


Alberto Asenjo
Data Journalist at Seedtag
One of the busiest online shopping days of the year lies within the holiday season leading up to the gift-giving month of December. Fitting snug between Thanksgiving and Christmas is an advertising gold mine: Black Friday. This deal-packed event drives a significant amount of online traffic as consumers take advantage of sales and offers. Using contextual AI, we have been able to track and analyze consumers’ exact interests surrounding the big day.
In 2020, traffic began rising around the Monday before the event, peaking on the event day, and slowly dropping until Cyber Monday. Of this content, 97% was found as brand-safe, making the Black Friday season an ideal period to integrate brand messages into relevant articles. Key drivers of consumer purchases include video games, fitness, beauty, and smartphones, all accounting for high traffic and thus forming an integral part of the Black Friday contextual universe.
Breaking Down the Interest Timeline
Despite being one day in the year, Black Friday, like in most cases, begins generating consumers' interest far before the event day itself. Understanding these peaks helps brands plan ahead and ensure their campaign covers the entire marketing period. Not to mention, making use of the early peaks of interest, in turn, maximizes your reach significantly.
Now, let's break down exactly when Black Friday starts attracting some attention. Kicking us off with a content peak is the first Monday before the event, in the case of 2020, Monday the 23rd. This is known as the "foresight peak," or a peak produced by readers wanting to anticipate the special discounts and promotions coming up. This Monday alone accounted for 8% of total traffic.
As expected, the period between Black Friday and Cyber Monday received the most attention, generating the highest interest with 44% of total traffic, as users scoured the web to find the best deals of the season. The main peak was held by Black Friday with 14% of visits, with traffic being higher than on Cyber Monday, which generated 10%.
Black Friday's origin was not specifically linked with technology, yet the strong association of the tech market with online sales meant the super savings day was the perfect opportunity for it to soar. It dominated in 2020, with 63.1% of visits being tech-related. But will this continue to be the case in the future?
As we'll dive into, publications associated with other product categories also trended – and in no small volume with 36.9% of total visits. One thing to be sure of: the public's growing familiarity and ease with online shopping will lead to an increase in non-technological content in the coming years.
Analyzing Black Friday’s Key Topics
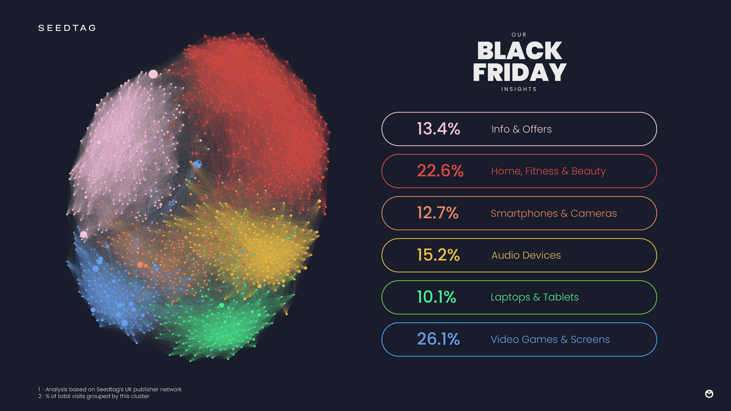
Video games & Screens [26.1% of total visits, 13% of total articles]
Driving some of the highest interest from users and leading in total visits was the Video Games and Screens category. This is due to the high attention received by articles that featured product reviews, best-of lists sorting high-tech televisions, and talks of the newest generation of consoles.
Without a doubt, November of 2020 was a crazy month for the console market. On the days leading up to Black Friday, Microsoft's Xbox dropped the global launch of the Xbox S & X Series on November 10th. Not long after, Sony's PlayStation released the PlayStation 5 on the 19th.
These long-awaited drops wreaked havoc as consumers jumped to get their hands on a console, with high demand triggering a bigger issue: a shortage of stock. This led to articles with intel on where and how to purchase the latest Xbox and PlayStation growing rapid interest – two of which made it on our Black Friday network as top-five publications.
Surprisingly, the scarcity of these gaming consoles is still a prevalent issue today, meaning this topic will continue to generate interest this coming Black Friday as users proceed to conduct research and try to resolve the long-debated Xbox vs. PS5 dispute.
Home, Fitness & Beauty [22.6% of total visits, 32% of total articles]
Another large category was Home, Fitness & Beauty, coming in second for total visits but accounting for the greatest total percentage of articles. Topics such as exercise and household appliances received the most attention, with users searching the web for deals on everything from fitness equipment to kitchen gadgets.
Additionally, there was an increase in the search for smart household appliances, or devices that are intelligent in the sense that they are connected to the internet as well as to other smart devices. This insight demonstrates an increasing “bridging of the gap” between the techie world and one's daily routine.
Audio Devices [15.1% of total visits, 15% of total articles]
The key players of the Audio Devices category included both headphones and earbuds, as well as speakers and assistants. These products received similar interest, but with the first two portability was highlighted while in the latter two audio quality was emphasized.
Moreover, our insights found that 81% of articles users read mentioned the adjective "good," while only 50.6% mentioned "cheap." This means, such as in the case of Audio Devices, consumers don't always search for low prices over high quality when researching their next purchase.
Info & Offers [13.4% of total visits, 18% of total articles]
In the category of Info & Offers, the type of content researched changes in respect to the previous categories. Despite 47% of articles featuring the word "best" in their title, and 19% including "review," the real winner of this category was compilation-style articles highlighting discounts and offers on select products. Product reviews and best-of lists took a back seat, partly because the interest level of technology products in this category is significantly lower.
Smartphones & Cameras [12.7% of total visits, 12% of total articles]
Following the tech-related theme, the Smartphones & Cameras category was also popular with readers last Black Friday. In the case of smartphones, the associated vocabulary and technology are becoming more and more related to areas such as photography and connectivity.
Additionally, the camera options have been increasing over time, including drones, professional, and adventure cameras. Increased camera quality for smartphones and the popularization of image/video-based social networking led the camera to be closely tied to smartphone specs, with 76.8% of articles mentioning smartphones also mentioning cameras.
Another interesting revelation includes a high connection between this category and internet speed, or products such as routers and repeaters. This relates to rising features like adventure cams with auto-upload features or 5G.
Laptops & Tablets [10.1% of total visits, 11% of total articles]
The Laptop & Tablets category has remained consistent over time in terms of what users want. Consumers seek devices that are increasingly lighter and more comfortable to use, without sacrificing good power and memory space.
Another key focus is on the level of their performance throughout daily use, such as working, studying, or gaming, and not just on their portability.
Consumers want products that are both comfortable to use and adaptable for their everyday routine.
Attracting the Reader’s Gaze
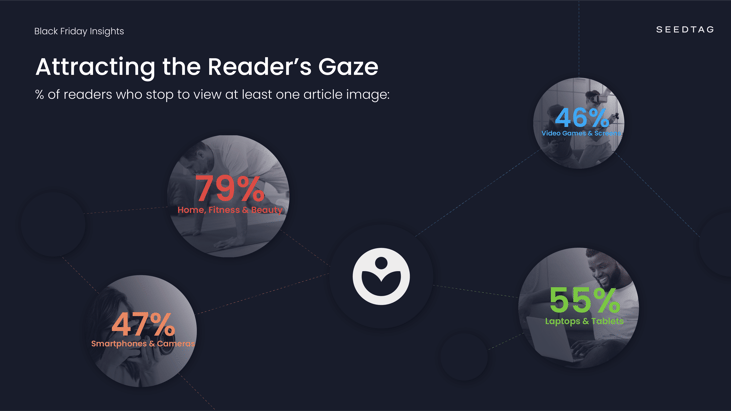
The use of images is quite common among digital publications, and in the case of Black Friday, this was definitely apparent. Visuals are incredibly useful here to show products as they are discussed. Nonetheless, the interest generated by images varies from topic to topic. Some media take more care in the design and quality of the images they publish, while others have the benefit of products that are more visually attractive.
Finally, we’ll present some of our insights showcasing how images are key to successful reads:
For example, within the Home, Fitness & Beauty category, multiple articles feature images with their text, increasing the probability of users stopping to give one a read, as 79% of visits stop in, at least, one of them. However, when taking into account the interest per image, those included in the Laptops & Tablets category stand out in terms of the number of users who stop to view them at 55% on average per image. This is followed by Smartphones & Cameras with 47%, and Video Games & Screens close behind with 46%.
------------
Our Data Origin
Using our contextual artificial intelligence, LIZ©, we have processed data from our network of publishers around the world, analyzing their content using Natural Language Processing (NLP), tagging each article according to its subject matter with one of our contextual categories, and identifying whether the content is brand safe for advertisers. We have filtered this information by date & topic, in this case, keeping articles between November 18th to December 2nd, 2020 that talked about Black Friday-related topics in our publisher network from the UK. Next, we performed structural and content analysis to understand the underlying dynamics of each topic and the relationship between them. We hope you find this information insightful!
The analytics shown along with other data points were used by our advertisers in real time to boost their campaigns and increase association with their brand values. If you are interested in knowing more about how contextual data and AI can boost your brand, feel free to contact us.
