


Alberto Asenjo
Data Journalist at Seedtag
Q2 2021 WORLDWIDE CONTENT TRENDS INSIGHTS REPORT
(April 1st - June 30th)
The upcoming summer months showed major influence within Q2. These months are often the ideal time to draw inspiration for summer plans, including travel, decor, and fashion, as well as an important season for sporting competitions, which generate great excitement as we prepare for a summer of cheering on our players and repping our team colors. Data also showed the desire to return to normalcy, in a context in which the effects of the pandemic were subsiding considerably, and a growing sense of responsibility towards climate change, especially in the automotive and new technology sectors.
In this Q2 analysis, we will review the most relevant content insights & trends - but where did our findings come from?
Using our contextual artificial intelligence, LIZ©, we have processed data from our network of publishers around the world, analyzing their content using Natural Language Processing (NLP), tagging each article according to its subject matter with one of our contextual categories and identifying whether the content is brand safe for advertisers. We have filtered this information by date, in this case Q2 (April 1st to June 30th, 2021) and compared it to the previous Q (January 1st to March 31st, 2021), evaluating each category separately according to the traffic it generated and the % of that traffic that is brand safe content (positivity)
Traffic and Brand Safety Variation Overview
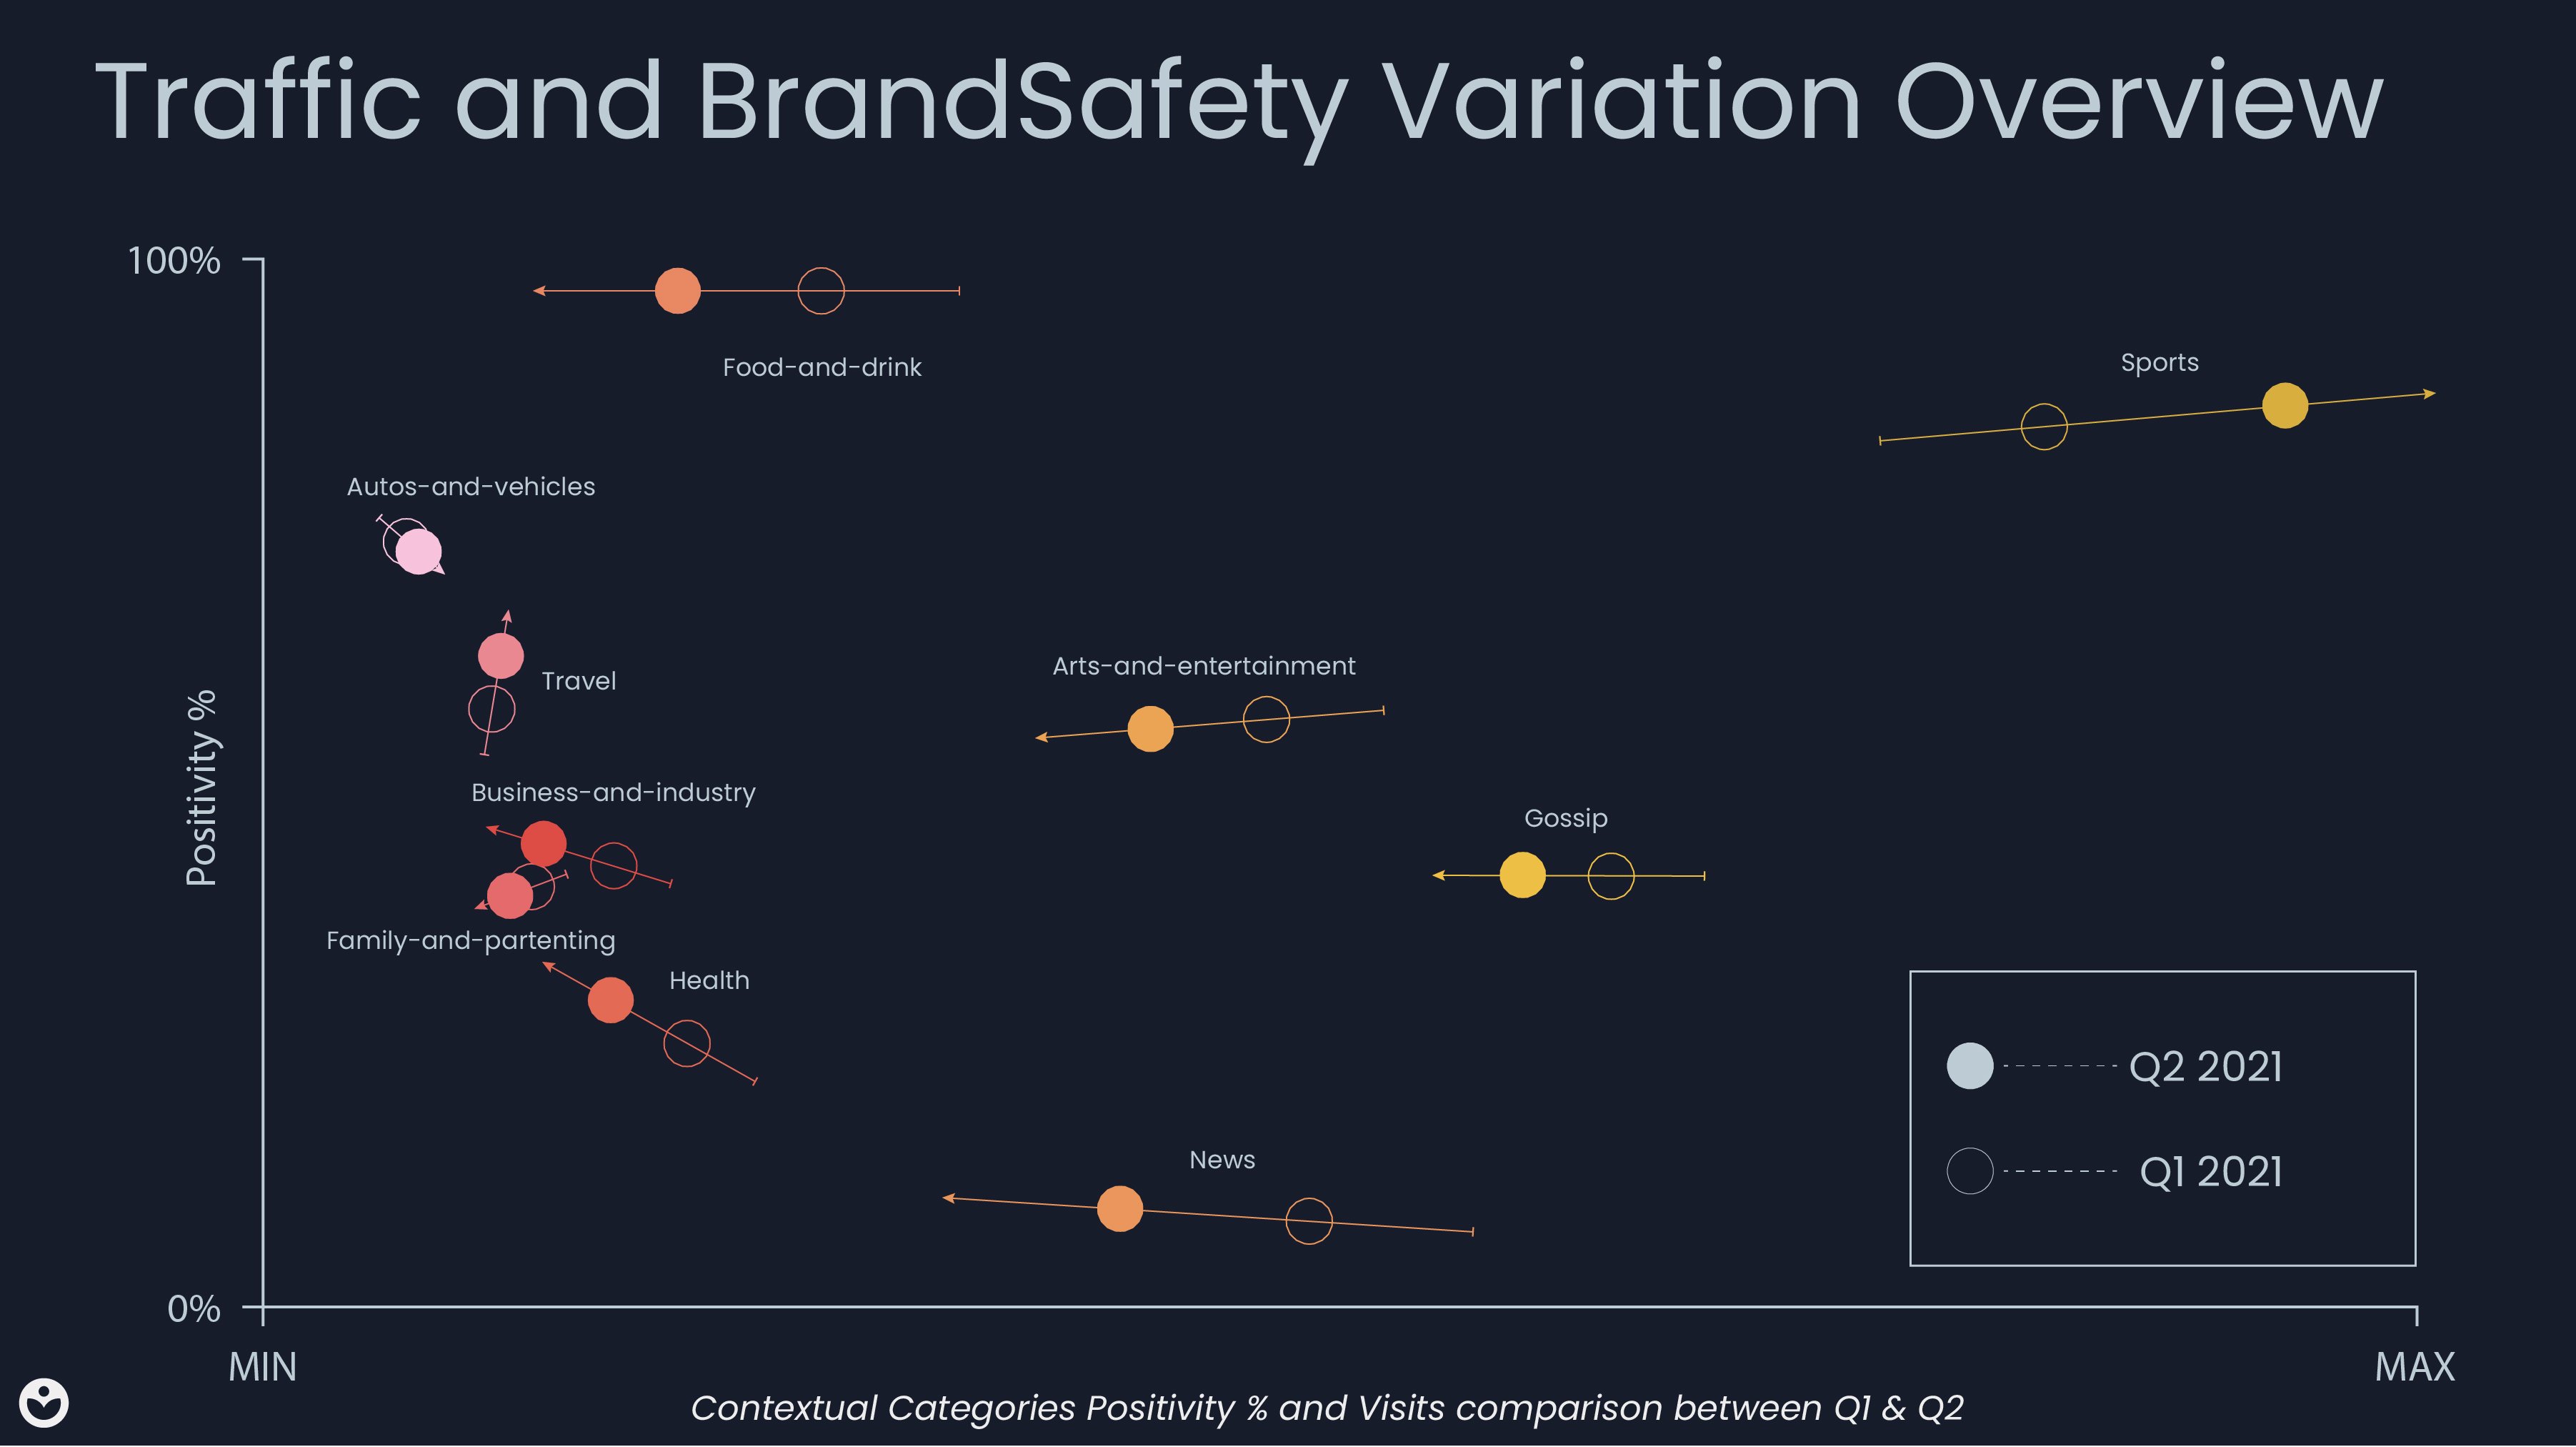
Here you will find some general insights regarding the dynamics throughout Q2. We have also grouped the information of the 10 most trafficked categories in one graph to make it easier for you to see the full picture.
Categories associated with activities away from home or affected by the pandemic and its restrictions showed positive indicators due to an overall increased interest and highly favorable messages surrounding them.
Autos-and-vehicles:
- 72.71% positivity
- 20.14% ▲ visits Q1-Q2
Travel
- 2.98% ▲ visits Q1-Q2
- 62.44% positivity
- 5.06% ▲ positivity Q1-Q2
Sports
- 13.57% ▲ visits Q1-Q2
- 85.71% positivity
- 1.58 ▲ positivity Q1-Q2
Home-and-garden (not among the 10 most visited)
- 81.57% positivity
Health
- 4.19 ▲ positivity Q1-Q2
Business-and-industry
- 7.79 ▲ positivity Q1-Q2
An increase in digital content consumption during the pandemic is not a new concept. However, with its reduction, certain categories noticed more of a shift of interest from "passive" to "active" and outdoor activities lost some of their traffic to other forms of entertainment.
News- 11.10% ▼ visits Q1-Q2
- 2.85% ▼ visits Q1-Q2
- 8.25% ▼ visits Q1-Q2
- 15.64% ▼ visits Q1-Q2
Regaining confidence in traveling
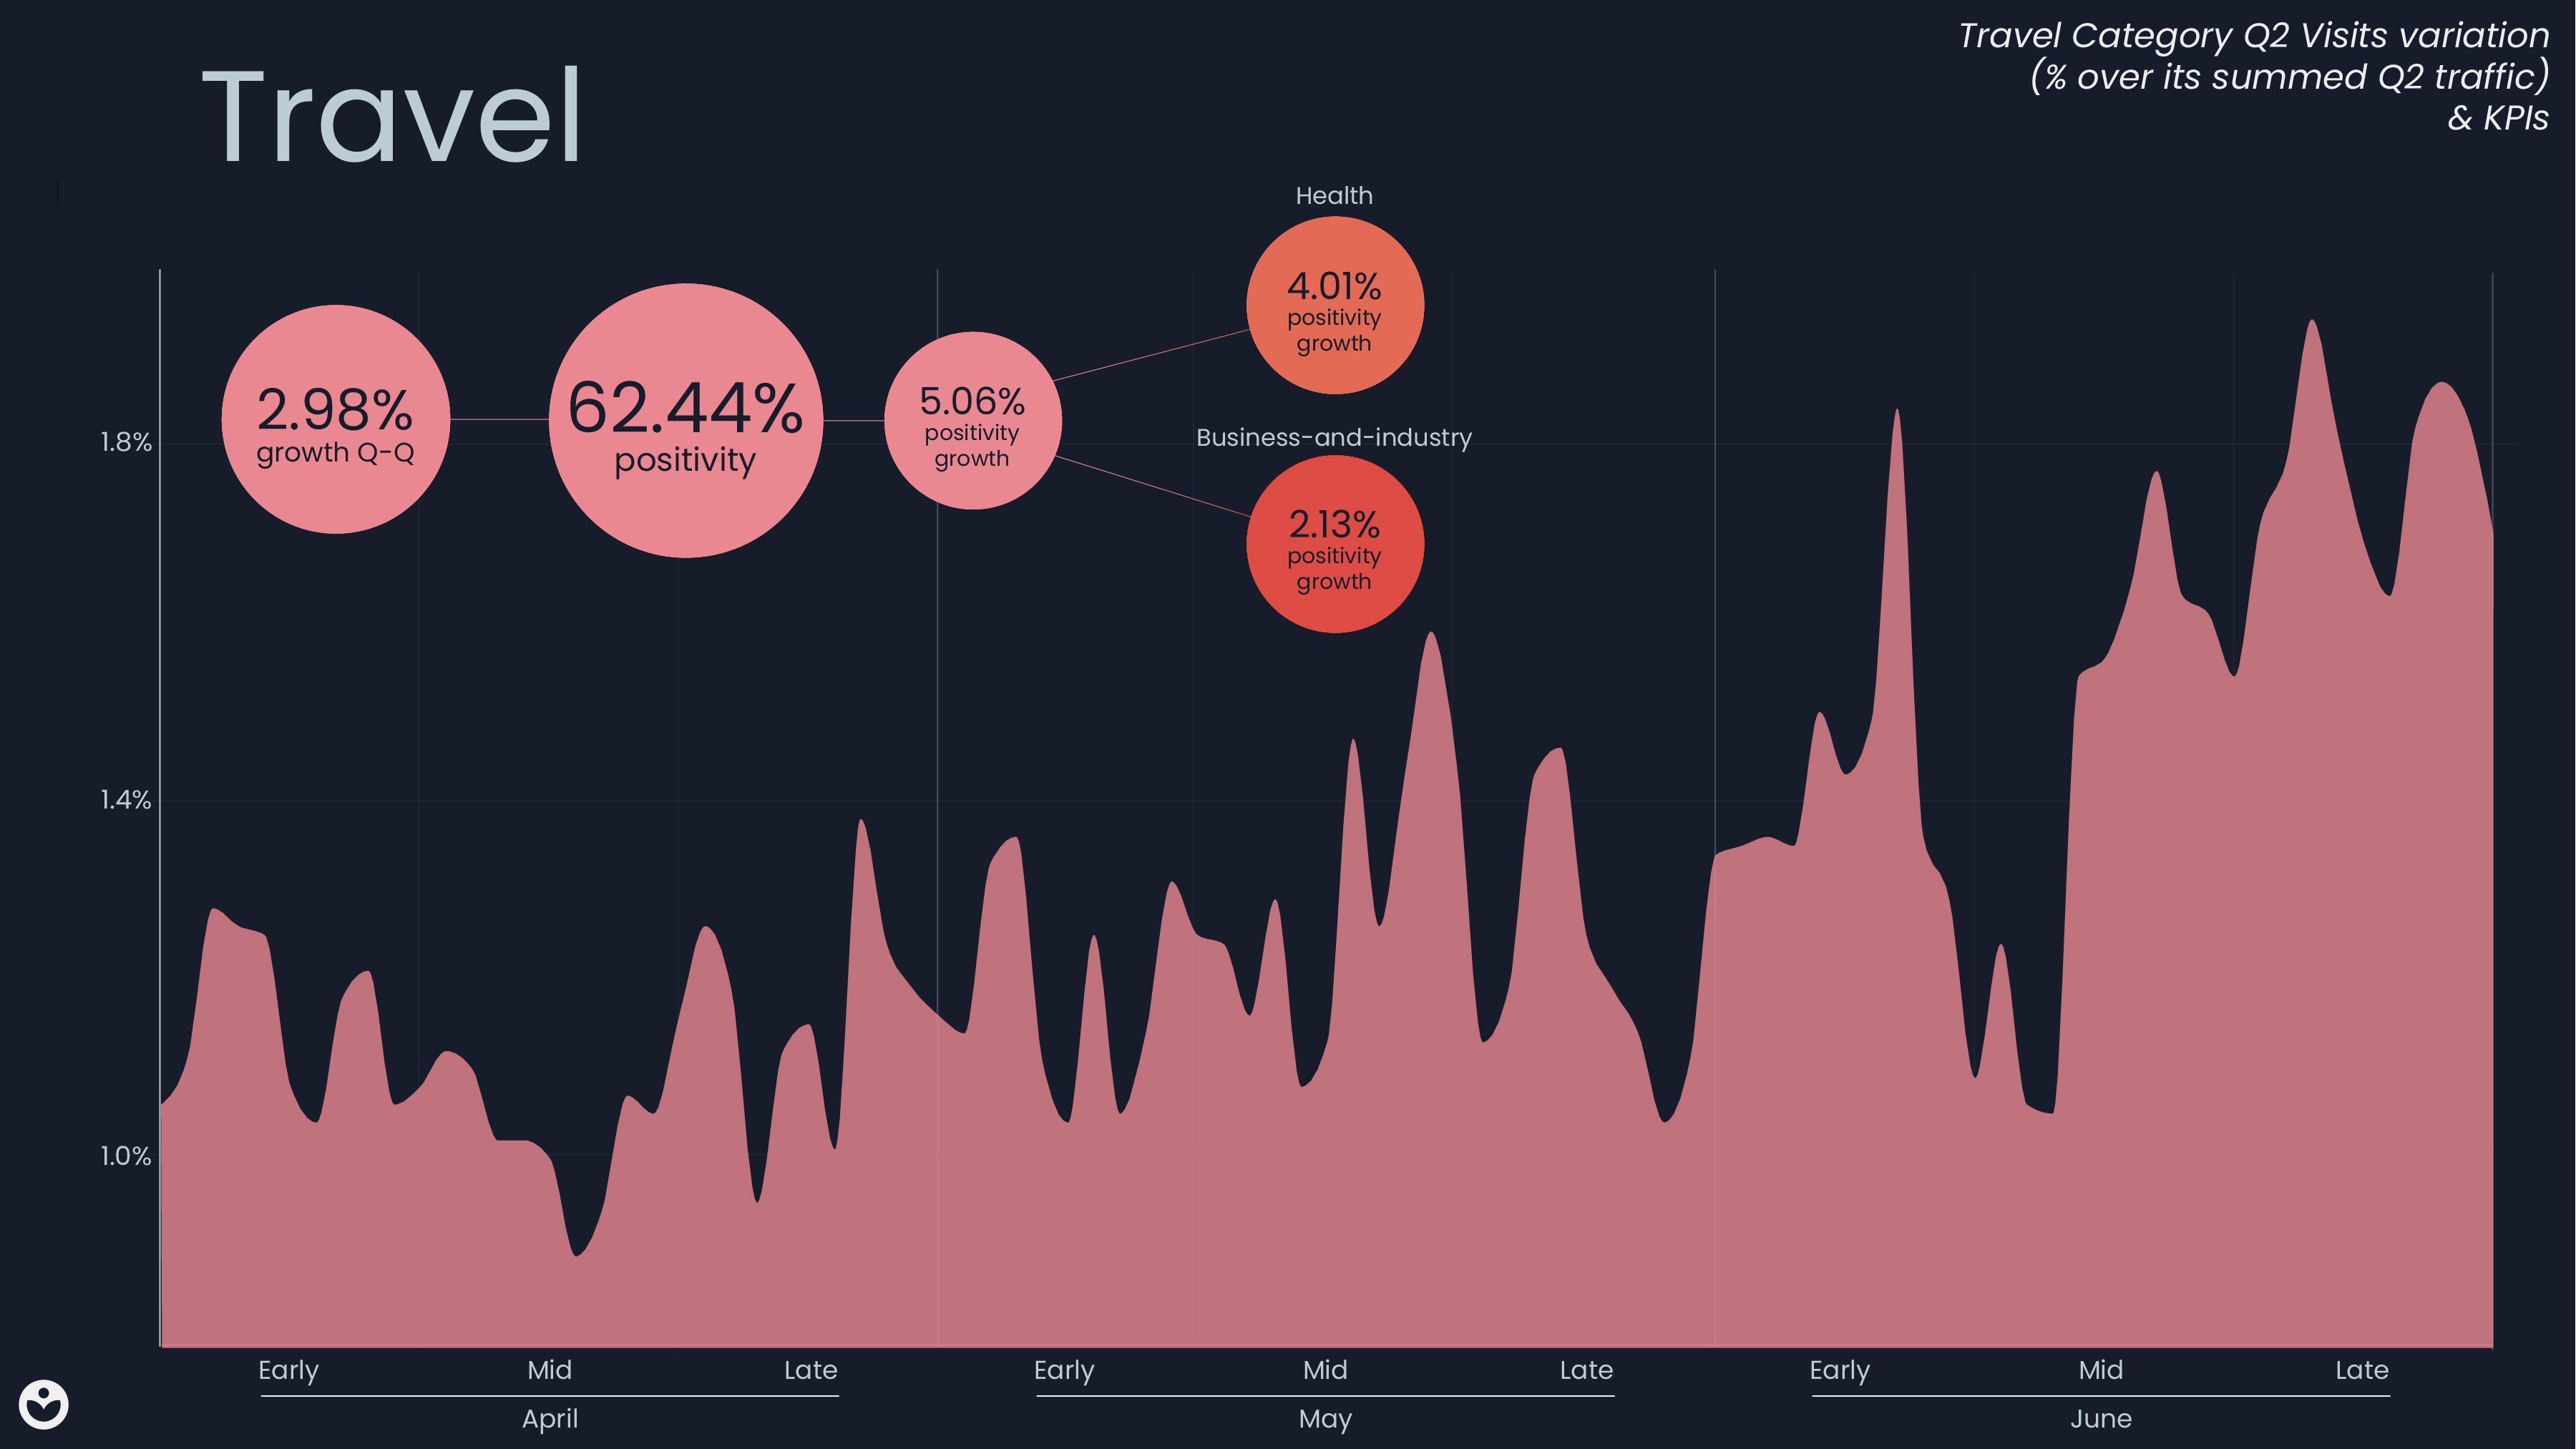
There are multiple topics grouped under our contextual category Travel: flights, vacation tips, travel guides, etc. In addition, each subcategory is focused on a different continent or region.
As can be seen in the visualizations, the increase of this category demonstrates progression as the summer approaches (shown in the upward trend of the graph and in the increase compared to the previous Q, 12.64% ▲) due to the interest in looking for things to do while on vacation: travel offers, ideal destinations, information on safety measures, etc.
It is noticeable that this summer was expected to be different from the previous one: the positivity with which travel was viewed was greater, with less concern about the pandemic and a hopeful feeling about the state of the economy. This can be seen in the high positivity value for Travel (61.77%), as well as the increase in positivity in this category (5.06 ▲) along with Health (4.01 ▲) and Business-and-industry (2.13 ▲).
Driving toward a cleaner future
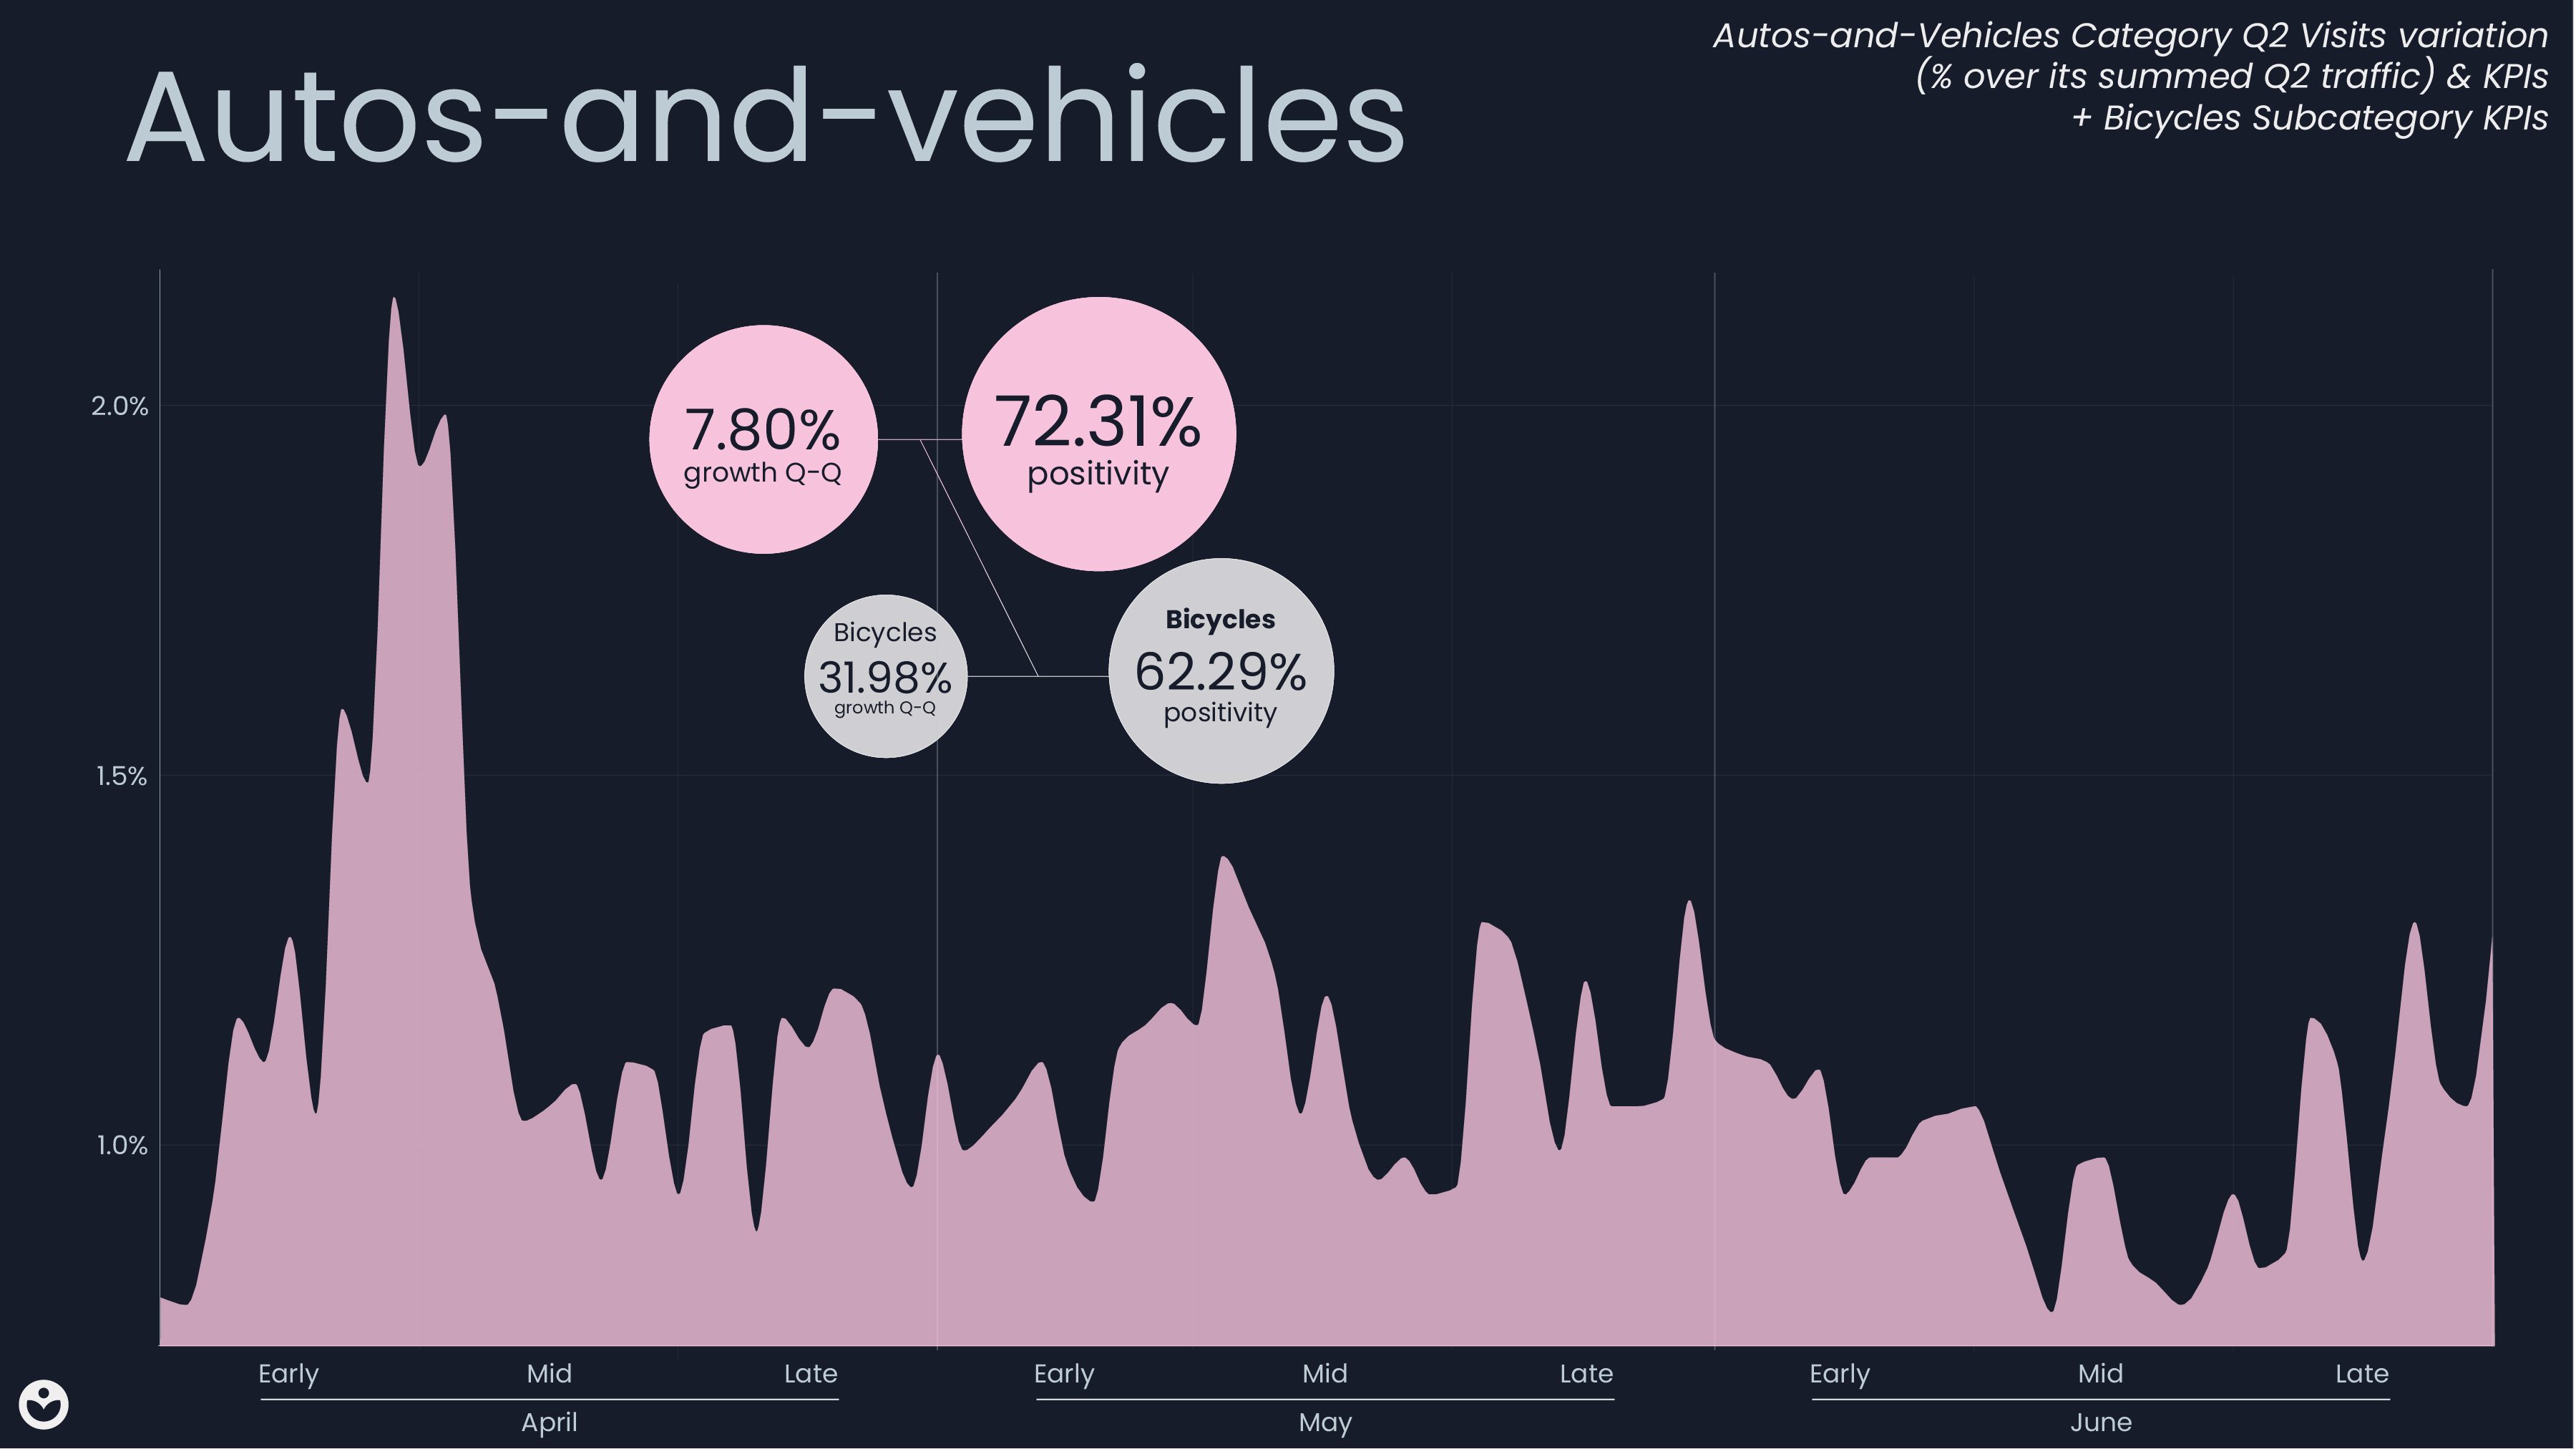
Autos-and-vehicles is a category that includes various forms of transport, including cars, bicycles, motorbikes, boats and watercraft, and hybrid and alternative vehicles. It encompasses content that shows a passion for motoring, along with new technologies and reducing the environmental footprint of vehicles.
In this area, we want to highlight the Bicycles subcategory. The mitigated effects of the pandemic together with the desire to move around the city by using clean and cheap ways of transportation have generated a noticeable growth in both categories,, as can be seen in the graph and in the variation with respect to the previous Q (7.80% ▲ in Autos-and-vehicles, 31.98% ▲ in Bicycles). At the same time, interest related to the chip supply shortage caused by the pandemic has also grown by the end of this Q. In addition, the media portrayal of these categories was very positive, especially for hybrid and alternative vehicles (31,98% of positivity in Bicycles, 82.92% of positivity in Hybrid-and-alternative), which are appreciated for their technological innovation, as well as the flexibility and the reduction of harmful effects on the planet they offer.
The reigning champion
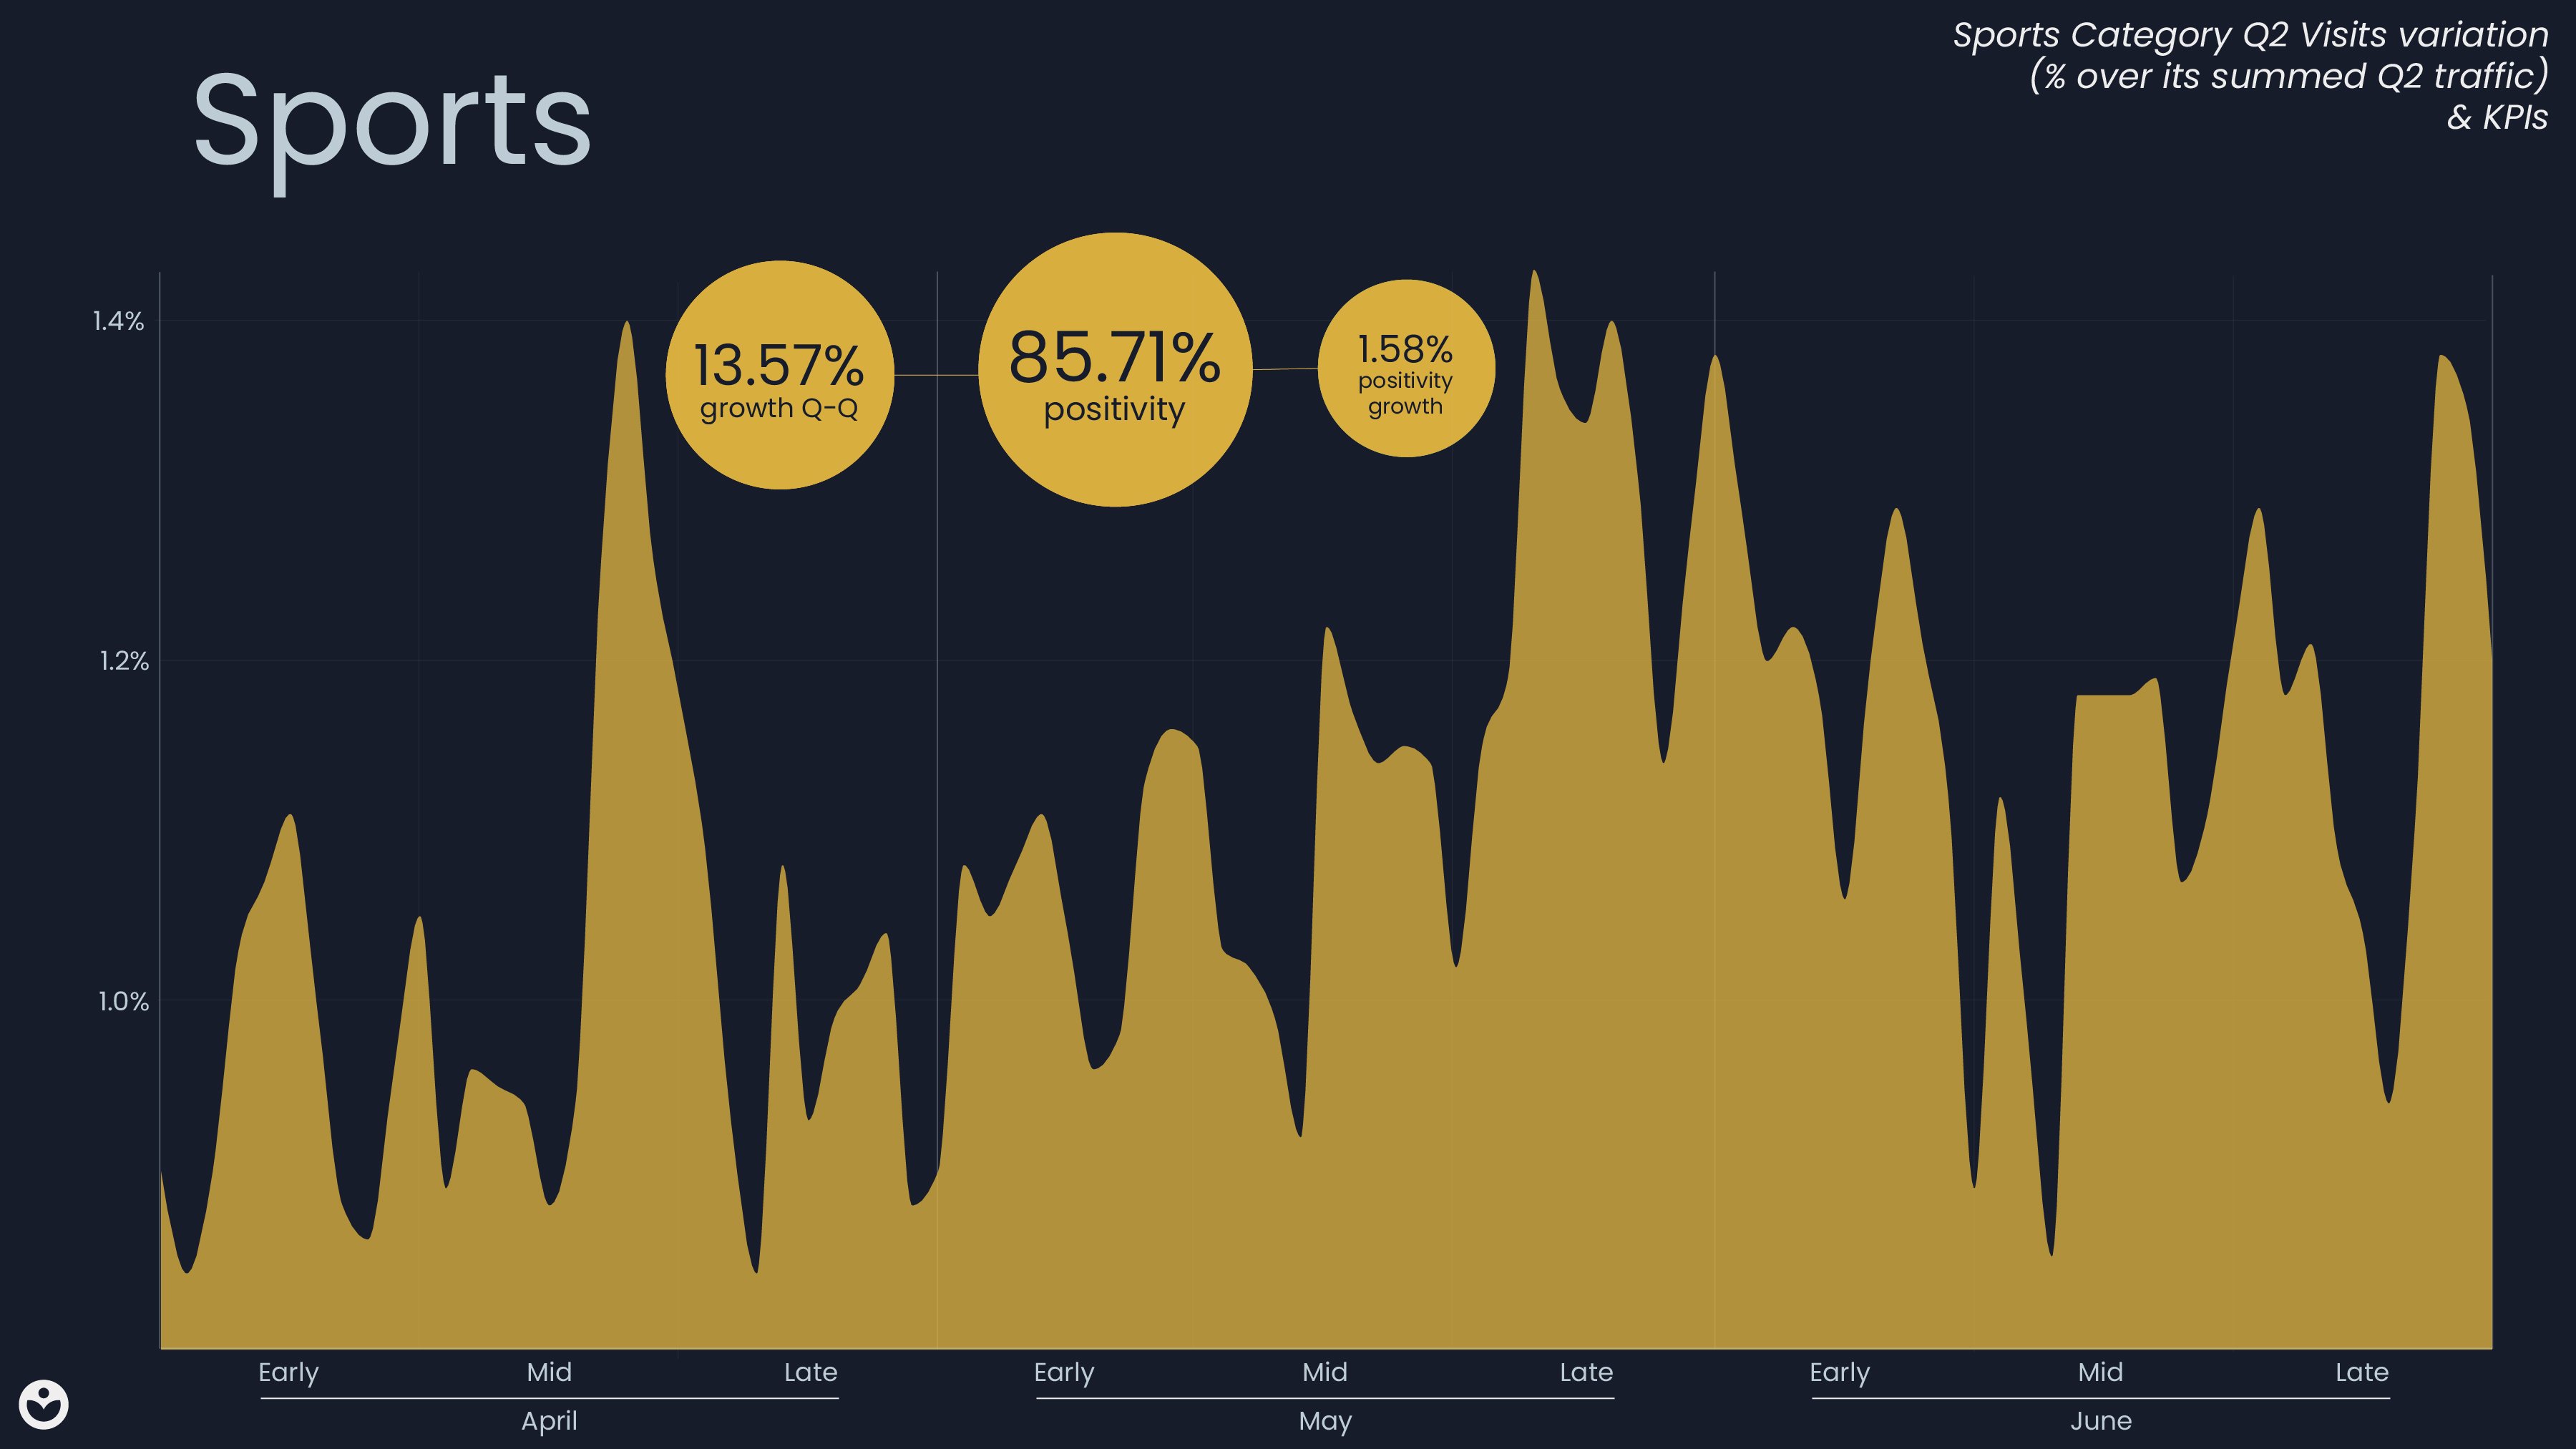
The privileged place that Sports holds among media publications is unquestionable. Reflected in our Sports category, you will find sports of all kinds : water sports, winter sports, extreme sports, motorsports, Olympic sports, and so on.
Its relevance surpasses any other category, and, in addition, the summer of 2021 was particularly interest-boosting for sports, due to crowds returning to stadiums, competitions and events (Eurocup, Olympics, Wimbledon, Tour de France, etc.). This interest is clearly reflected in our data, with this category ranking first by volume (18.25% of total traffic) and holding a difference of 7 percentage points over the next highest category.
Sports is not only the current leader in our network by volume, it has also substantially surpassed its previous figures, with a 13.57% ▲ growth over the previous Q's numbers . Furthermore, taking into account the timeline, you can see the clear effect soccer competitions have recently had. First of all, it’s very easy to see the peak of interest generated by the announcement of the creation of the European Super League and the debate surrounding it as a hot topic (April 17th-22nd). Moreover, the trend highlights a progressive growth from directly after this event up until the end of May due to the last rounds of the European Premier Leagues, and closing the month with the finals of the UEFA Champions League and the UEFA Europa League. Finally, from June 11th onward, the growth generated by the beginning of the UEFA European Championship is considerably measurable.
The optimistic morals of sports and the media's way of communicating news are reflected in the positive values of this category, and, furthermore, its positivity is 1.58 ▲ percentage points higher than that of the previous Q.
All these findings have set a very hopeful and promising base for Q3, as the "Summer of Sports" prevails, with the European Championship and the Olympics, among many other competitions, taking place.
------------
The analytics shown along with other data points were used by our advertisers in real time to boost their campaigns and increase association aligned with their brand values. If you are interested in knowing more about how contextual data and AI can boost your brand, feel free to contact us.
