


Rocio Bourg
Content Writer
Another Q, another recap of relevant, data-driven findings. In this report, we break down global content trends found in Q4 that prevailed, and those that fell short. Powered by Seedtag’s contextual AI solution, LIZ©, we discovered the last few months of the year to be a time spent enjoying meals, consuming entertainment, and reflecting on not only what has happened, but also what’s to come. Also mentioned, family, sports, and fashion, and the logic behind why insights show a positive incline in some categories, but a downfall in others.
Q4 Global Contextual Trends Report
As 2021 came to a close with the last Q of the year, these months stood out as a time in which individuals joined together in reflection over the past year and consideration of what awaits in 2022. It is also a time of enjoyment, as we turn our interest to seasonal movies and television, gift-giving, and holiday foods, treats, and beverages.
Consequently, these trends for the season paved the way for the categories of Arts and Entertainment, Business and Industry, and Food and Drink, to become relevant leaders in growth and interest since the last quarter. Additionally, further categories that also made notable growth in these months include Family and Parenting, Science, Technology, and Winter Sports.
Traffic & Brand Safety Variation Overview
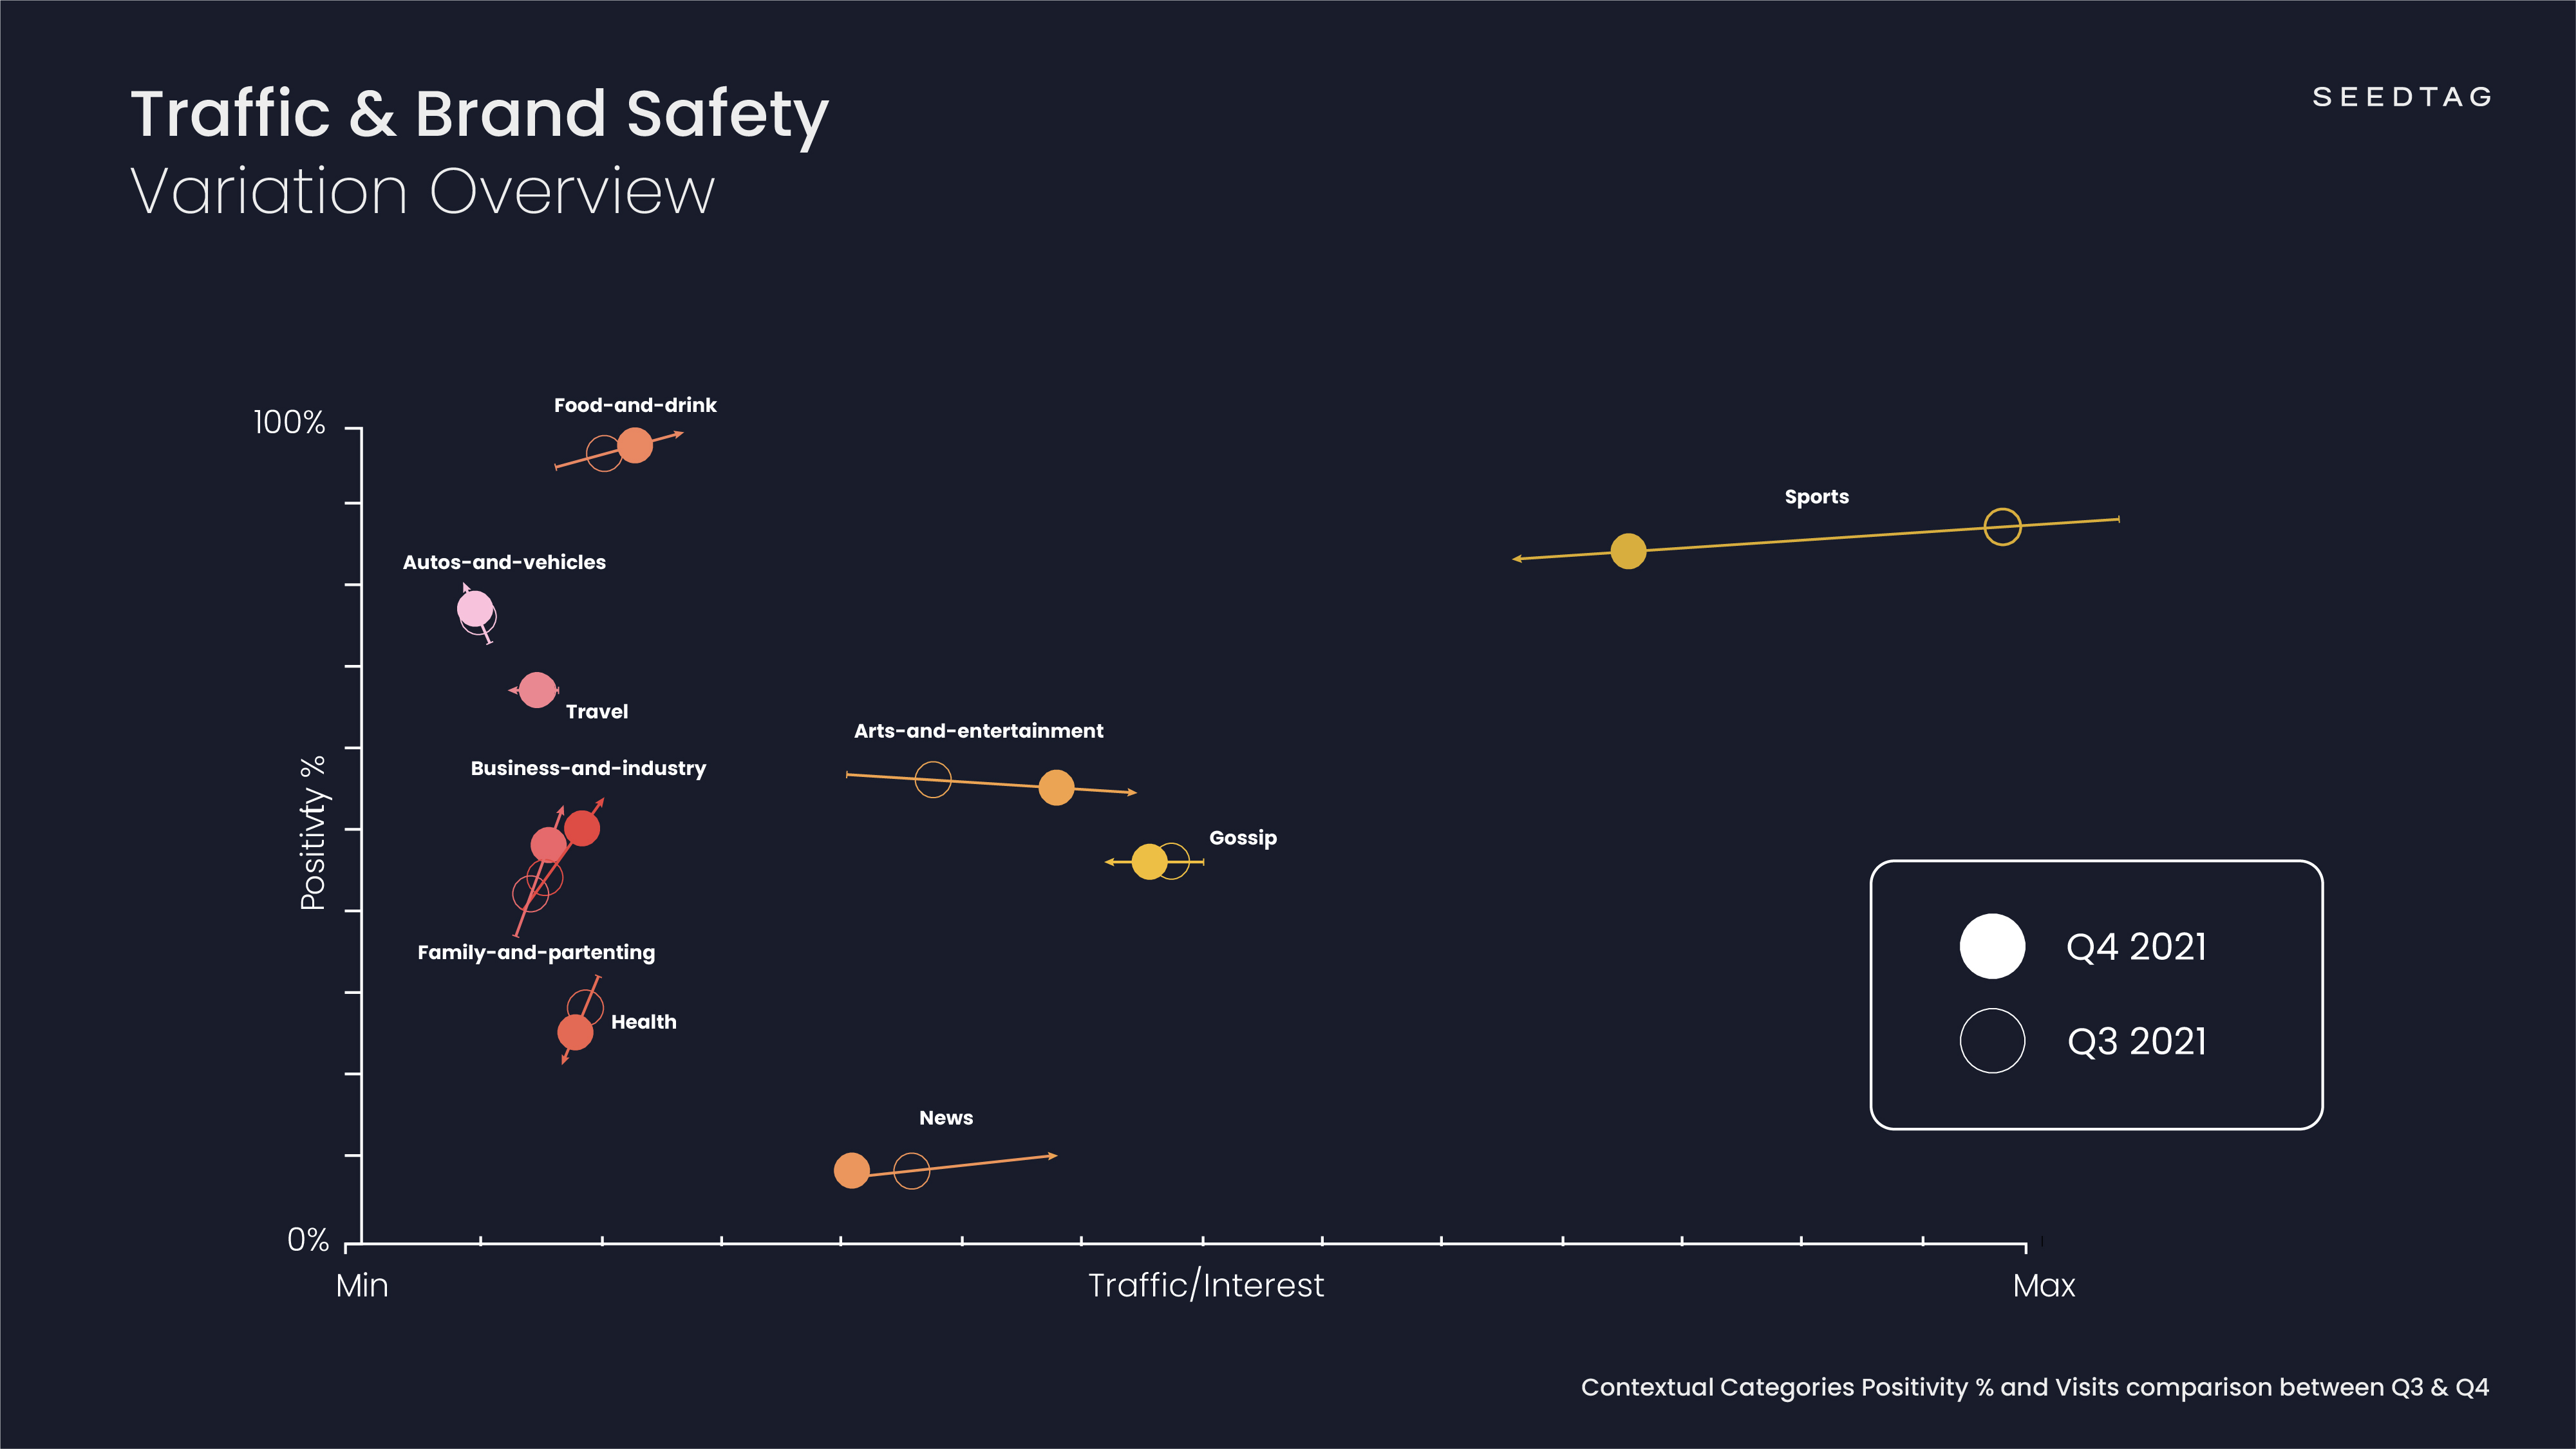
As you read on, you’ll find a breakdown of some general insights regarding the dynamics throughout Q4. We have also grouped the topmost trafficked categories in the graph above, making it easier for you to see an overall Q/Q look at what thrived and what sank this past quarter.
Being that this Q takes place between the particularly holiday-heavy months of October, November, and December, internet content consumption will of course change according to consumer habits, leading to an increase in certain categories. The category which faced the biggest growth this Q was Arts and Entertainment, as anticipated with the high consumption of holiday-related movies, music, and TV. As shown below, this season also produced an increase in the Business and Industry category, as the end of the year brings attention to the news, both reviewing the past and setting expectations for the coming future. The categories of Food and Drink and Family and Parenting saw growth as well, also heavily influenced by the holiday season.
Arts and Entertainment- 22% ▲ visits Q3-Q4
- 55% positivity
- 2% ▼ positivity Q3-Q4
- 20% ▲ visits Q3-Q4
- 50% positivity
- 6% ▲ positivity Q3-Q4
- 12% ▲ visits Q3-Q4
- 97% positivity
- 1% ▲ positivity Q3-Q4
- 11% ▲ visits Q3-Q4
- 47% positivity
- 5% ▲ positivity Q3-Q4
Although certain categories saw ample growth this Q, other categories saw a significant decrease in visits. Of these, Sports declined as no major championships or sporting events were held over this period that would drive notable traffic, comparable to last Q's sport-heavy numbers. Style and Fashion, as well as Beauty and Personal Care, also saw a decrease, as these also quieted down for the holiday season. Because the summer tends to see a considerable influx of growth, it results in this Q having a rather dramatic decrease in the mentioned categories. Events such as Black Friday, held in Q4, do still hold an impact, however, it is not enough to beat the skyrocketing peak of Q3.
Sports- 22.76% ▼ visits Q3-Q4
- Style and Fashion
- 21.45% ▼ visits Q3-Q4
- 10.63% ▼ visits Q3-Q4
- Beauty and Personal Care
- 9.37% ▼ visits Q3-Q4
A Season of Arts & Entertainment
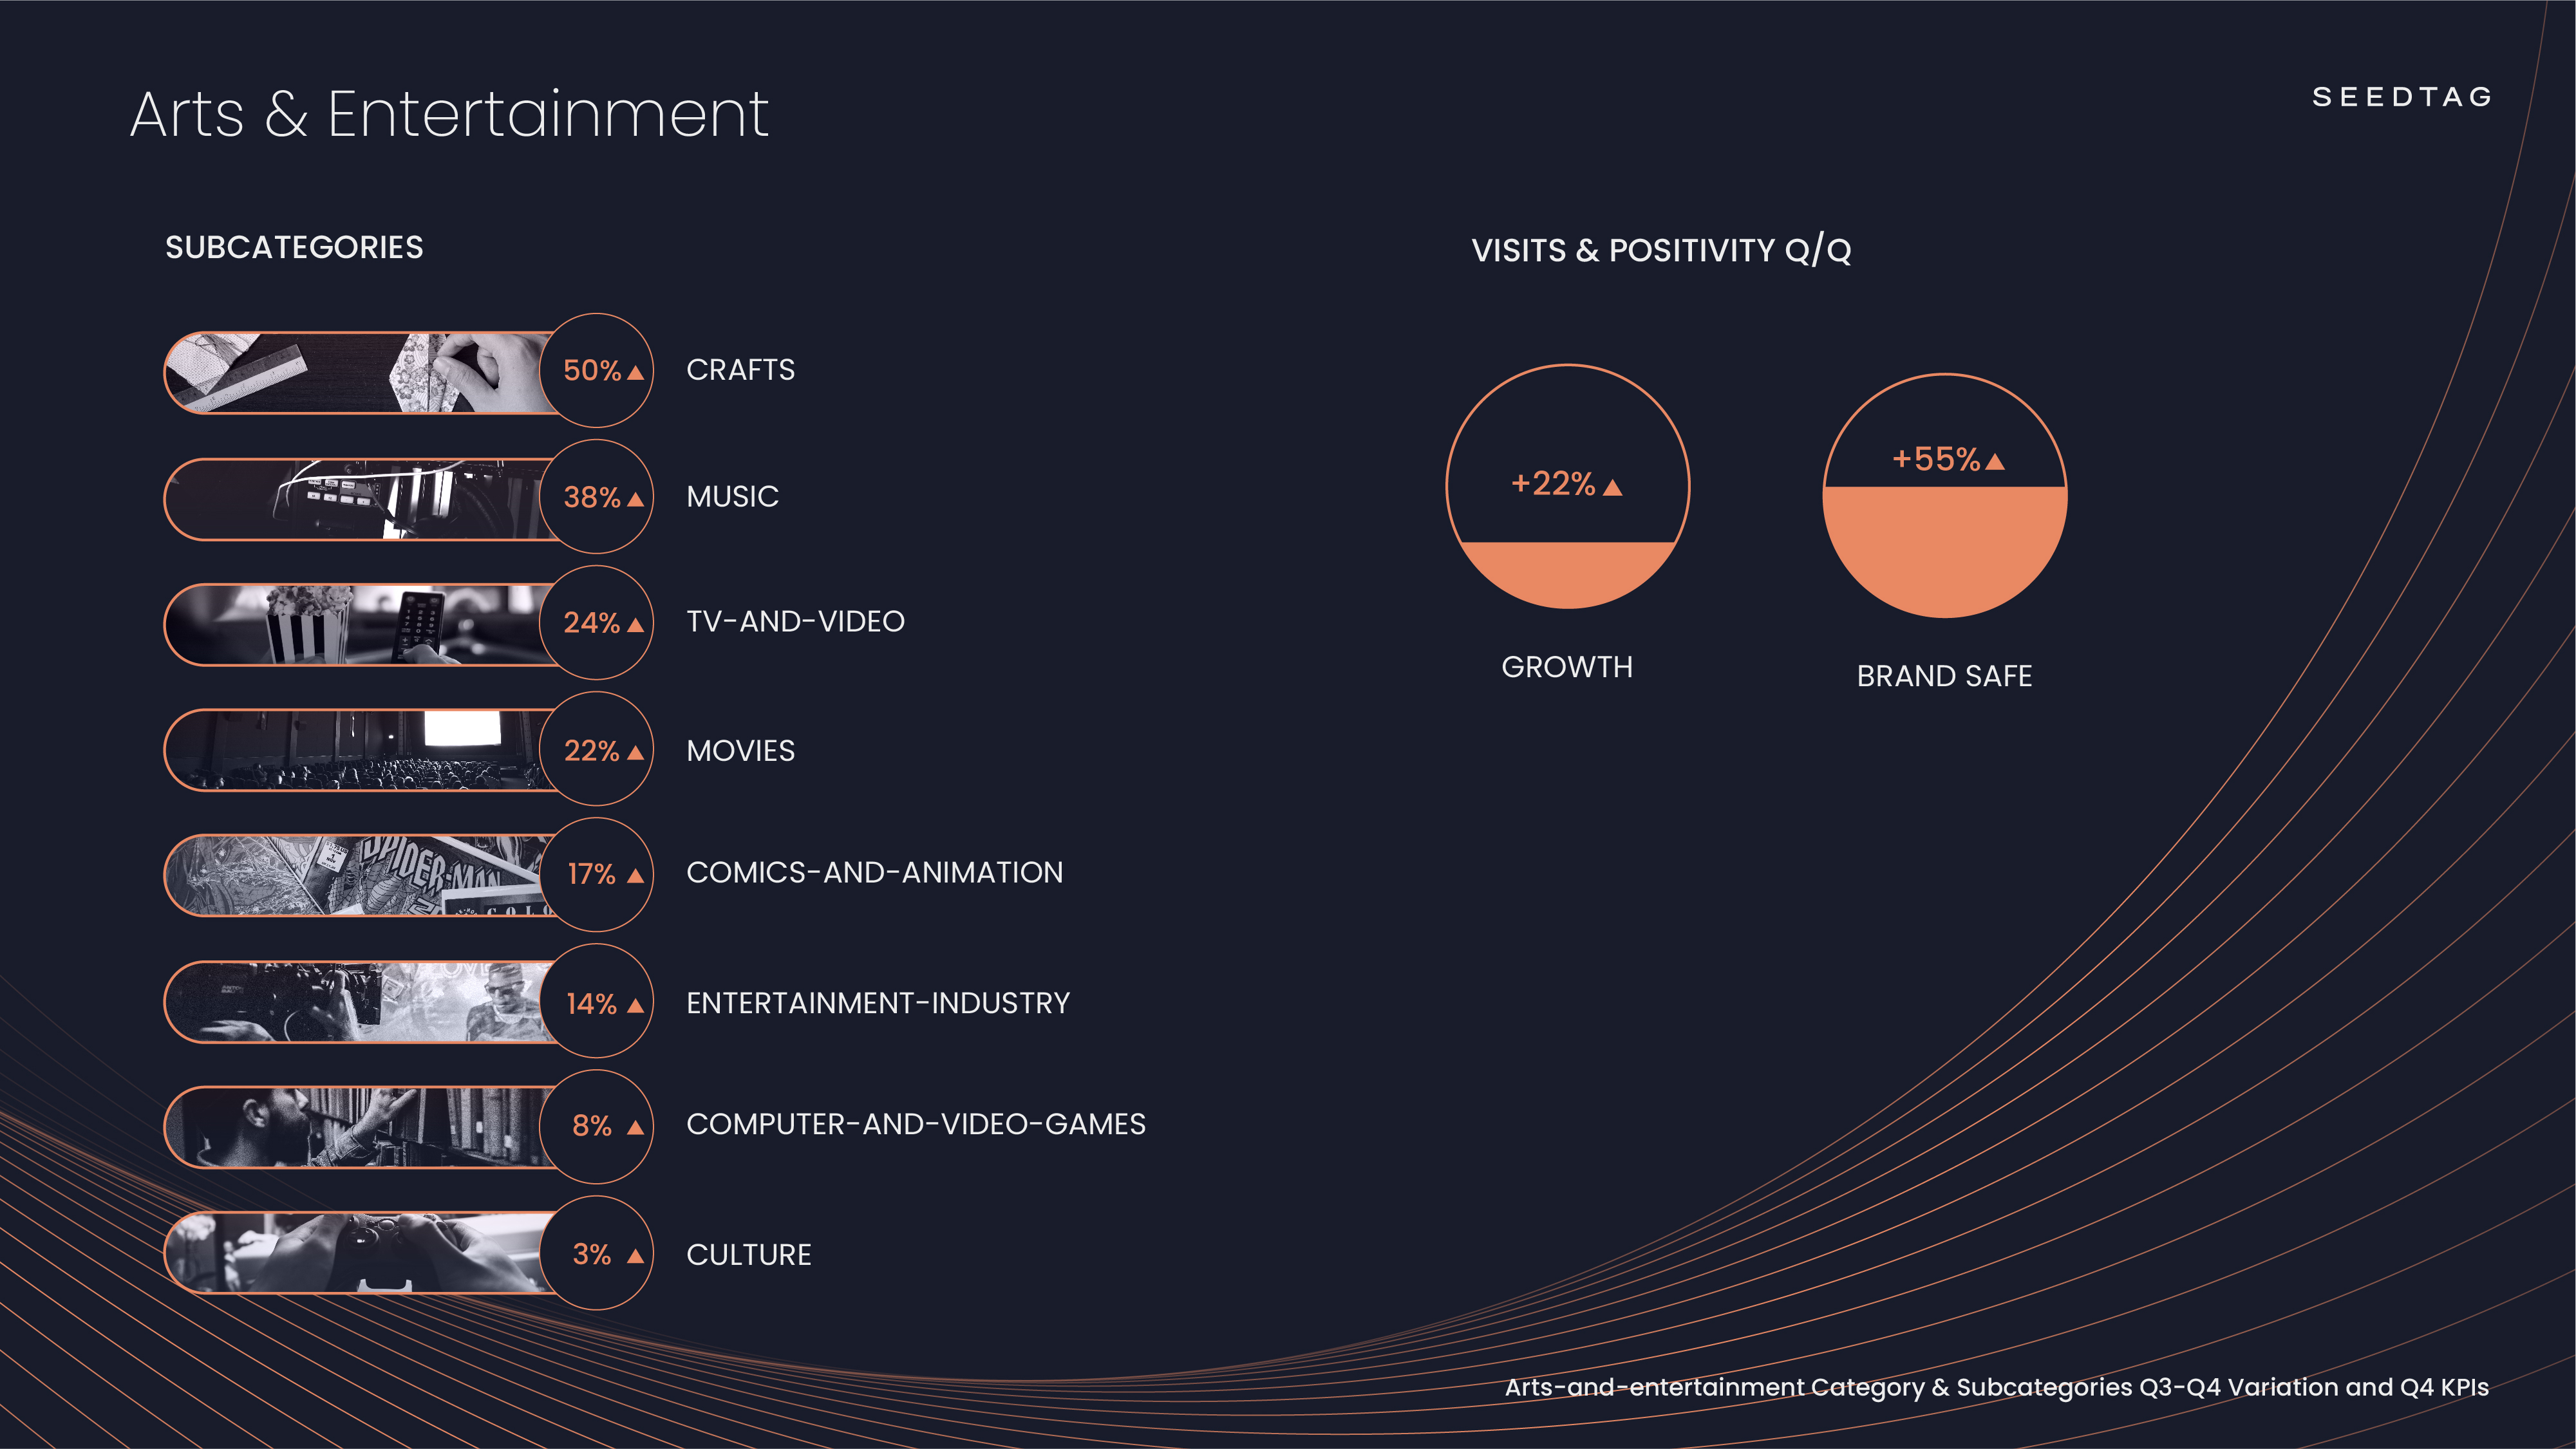
Leading with the biggest growth of the quarter was the Arts and Entertainment category (22% ▲). Despite a small reduction in positivity, or percentage of content that was deemed brand-safe, the total positivity remained high at 55%. Many of its subcategories flourished this time of year, in part due to the change in weather in the northern hemisphere resulting in a direct decrease in interest in outdoor activities. Particularly, music, movies, TV, and video all saw an increase in this Q. In other words, more individuals turned to these forms of entertainment as they remained indoors to beat the cold.
As previously mentioned, this quarter also falls along the most festive time of the year, including several holidays such as Halloween, Thanksgiving, and Christmas. The largest subcategory was Crafts, accounting for a 50% growth this Q, followed by Music with 38%, TV with 24%, and Movies with 22%. Accordingly, seasonal films, tunes, and series also tend to peak during these months.
On the subject of peaks, this Q also included a few key events that led to various data spikes within the category. Of these, on October 17th HBO's Succession returned for its third season, driving interest in TV. On October 22nd, there was a peak in movie-related content due to the Alec Baldwin incident on the set of the western film Rust, an example of a situation that hindered brand-safe content. On November 5th, a peak in movie content was brought on by the premiere of Marvel Studios' Eternals. On November 6th, music content saw a peak caused by the crowd surge incident at American rapper Travis Scott's concert in Texas. On November 19th, another interest peak in the music industry, this time positive, was Adele's release of her album 30. On December 3rd, a peak in TV with Netflix’s Money Heist dropping part 2 of season 5. On December 17th, another in movies with the anticipated premiere of Spider-Man: No Way Home hitting the theaters worldwide. Finally, a peak in TV on December 22nd as Netflix's Emily in Paris returned for a second season.
A Season of Business & Industry
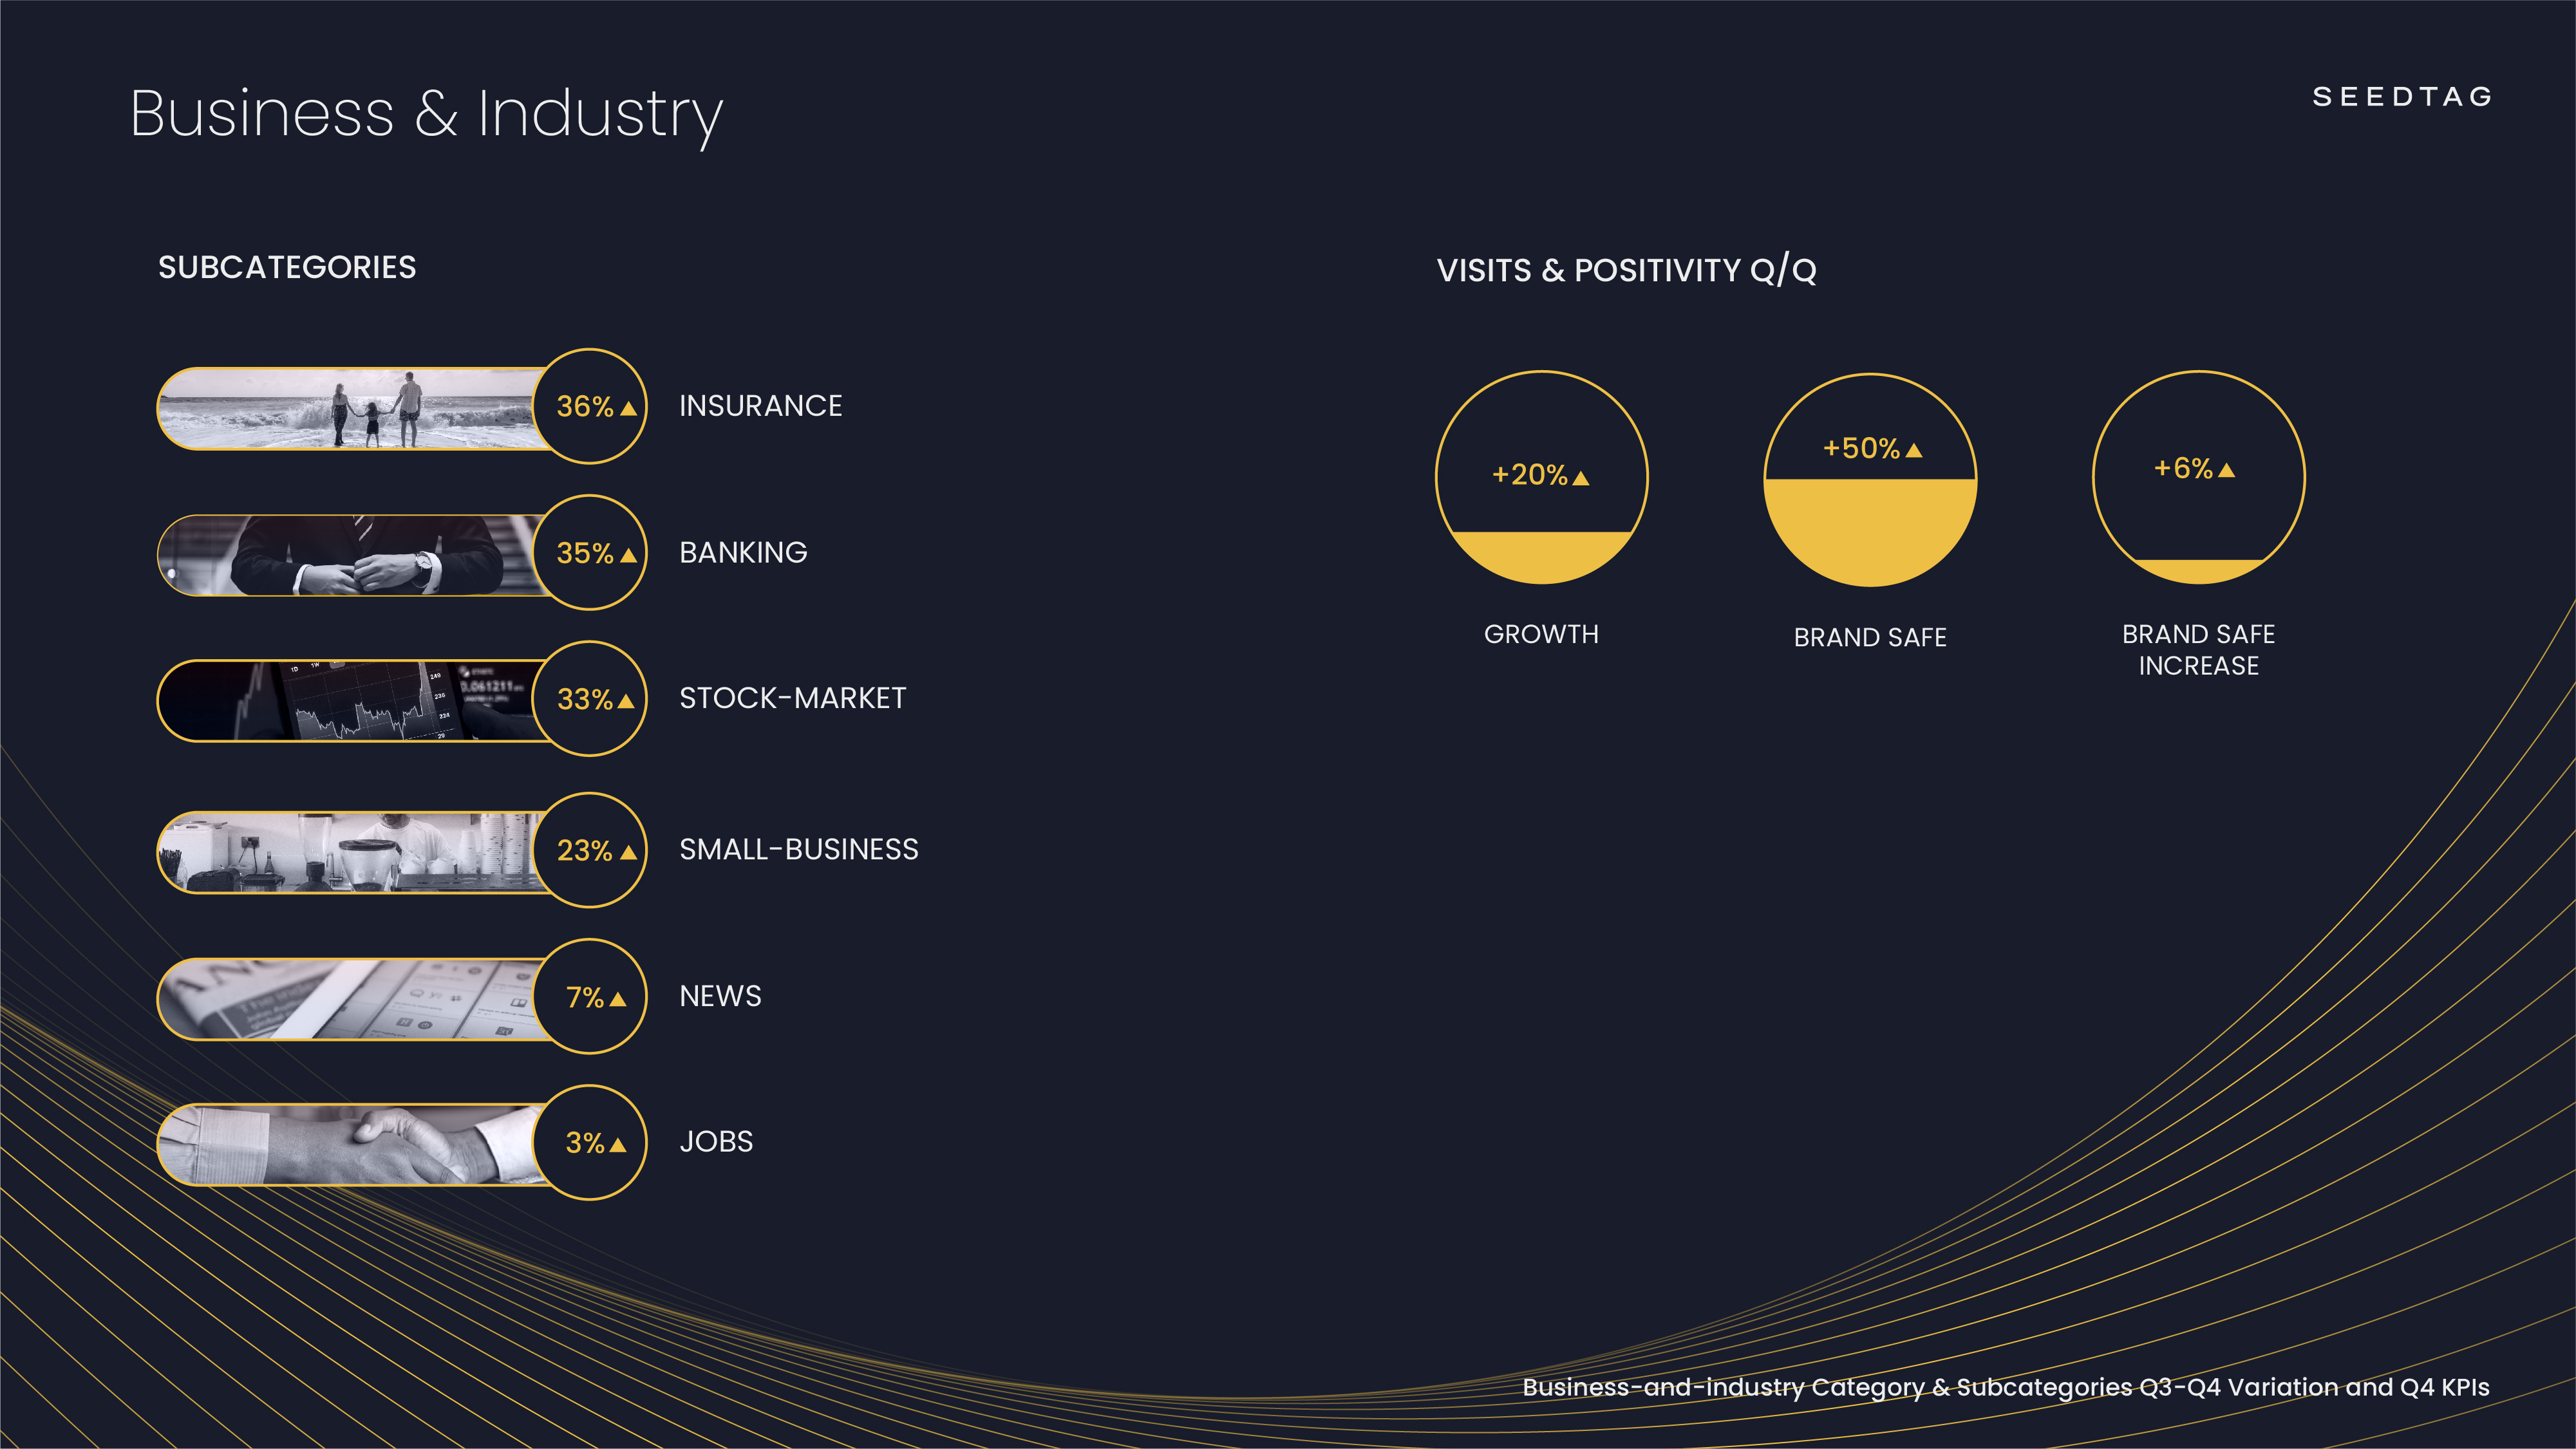
The next largest category of the quarter was Business and Industry (20% ▲), with growth in both visits and related positivity at a steady 50%. This sector's gain is in part caused by a surge in end-of-the-year news recapping the past year from a business perspective, as well as expectations and predictions for the coming year in technology and science. Trending news issues include new tech to be incorporated within the industry, and how businesses will utilize these advancements in the future. The increase in this category is also driven by more searches relating to jobs, small businesses, and banking, caused by individuals wanting to take on new projects in the coming year. That being said, the subcategories with the greatest growth this Q were Insurance with 36%, Banking with 35%, Stock Market with 33%, and Small Business with 23%.
Key peaks in data within this category are directly related to subjects including space exploration, big data, and AI. Additionally, business news within the industry also caused peaks of interest, such as on October 4 when a massive Whatsapp, Instagram & Facebook outage drove particular traffic to sites with intel. Another key event within the industry was the James Webb Space Telescope launch on December 24, driving attention as it set out on a rocket with an aim of eventually producing the first science-quality images.
A Season of Food & Drinks
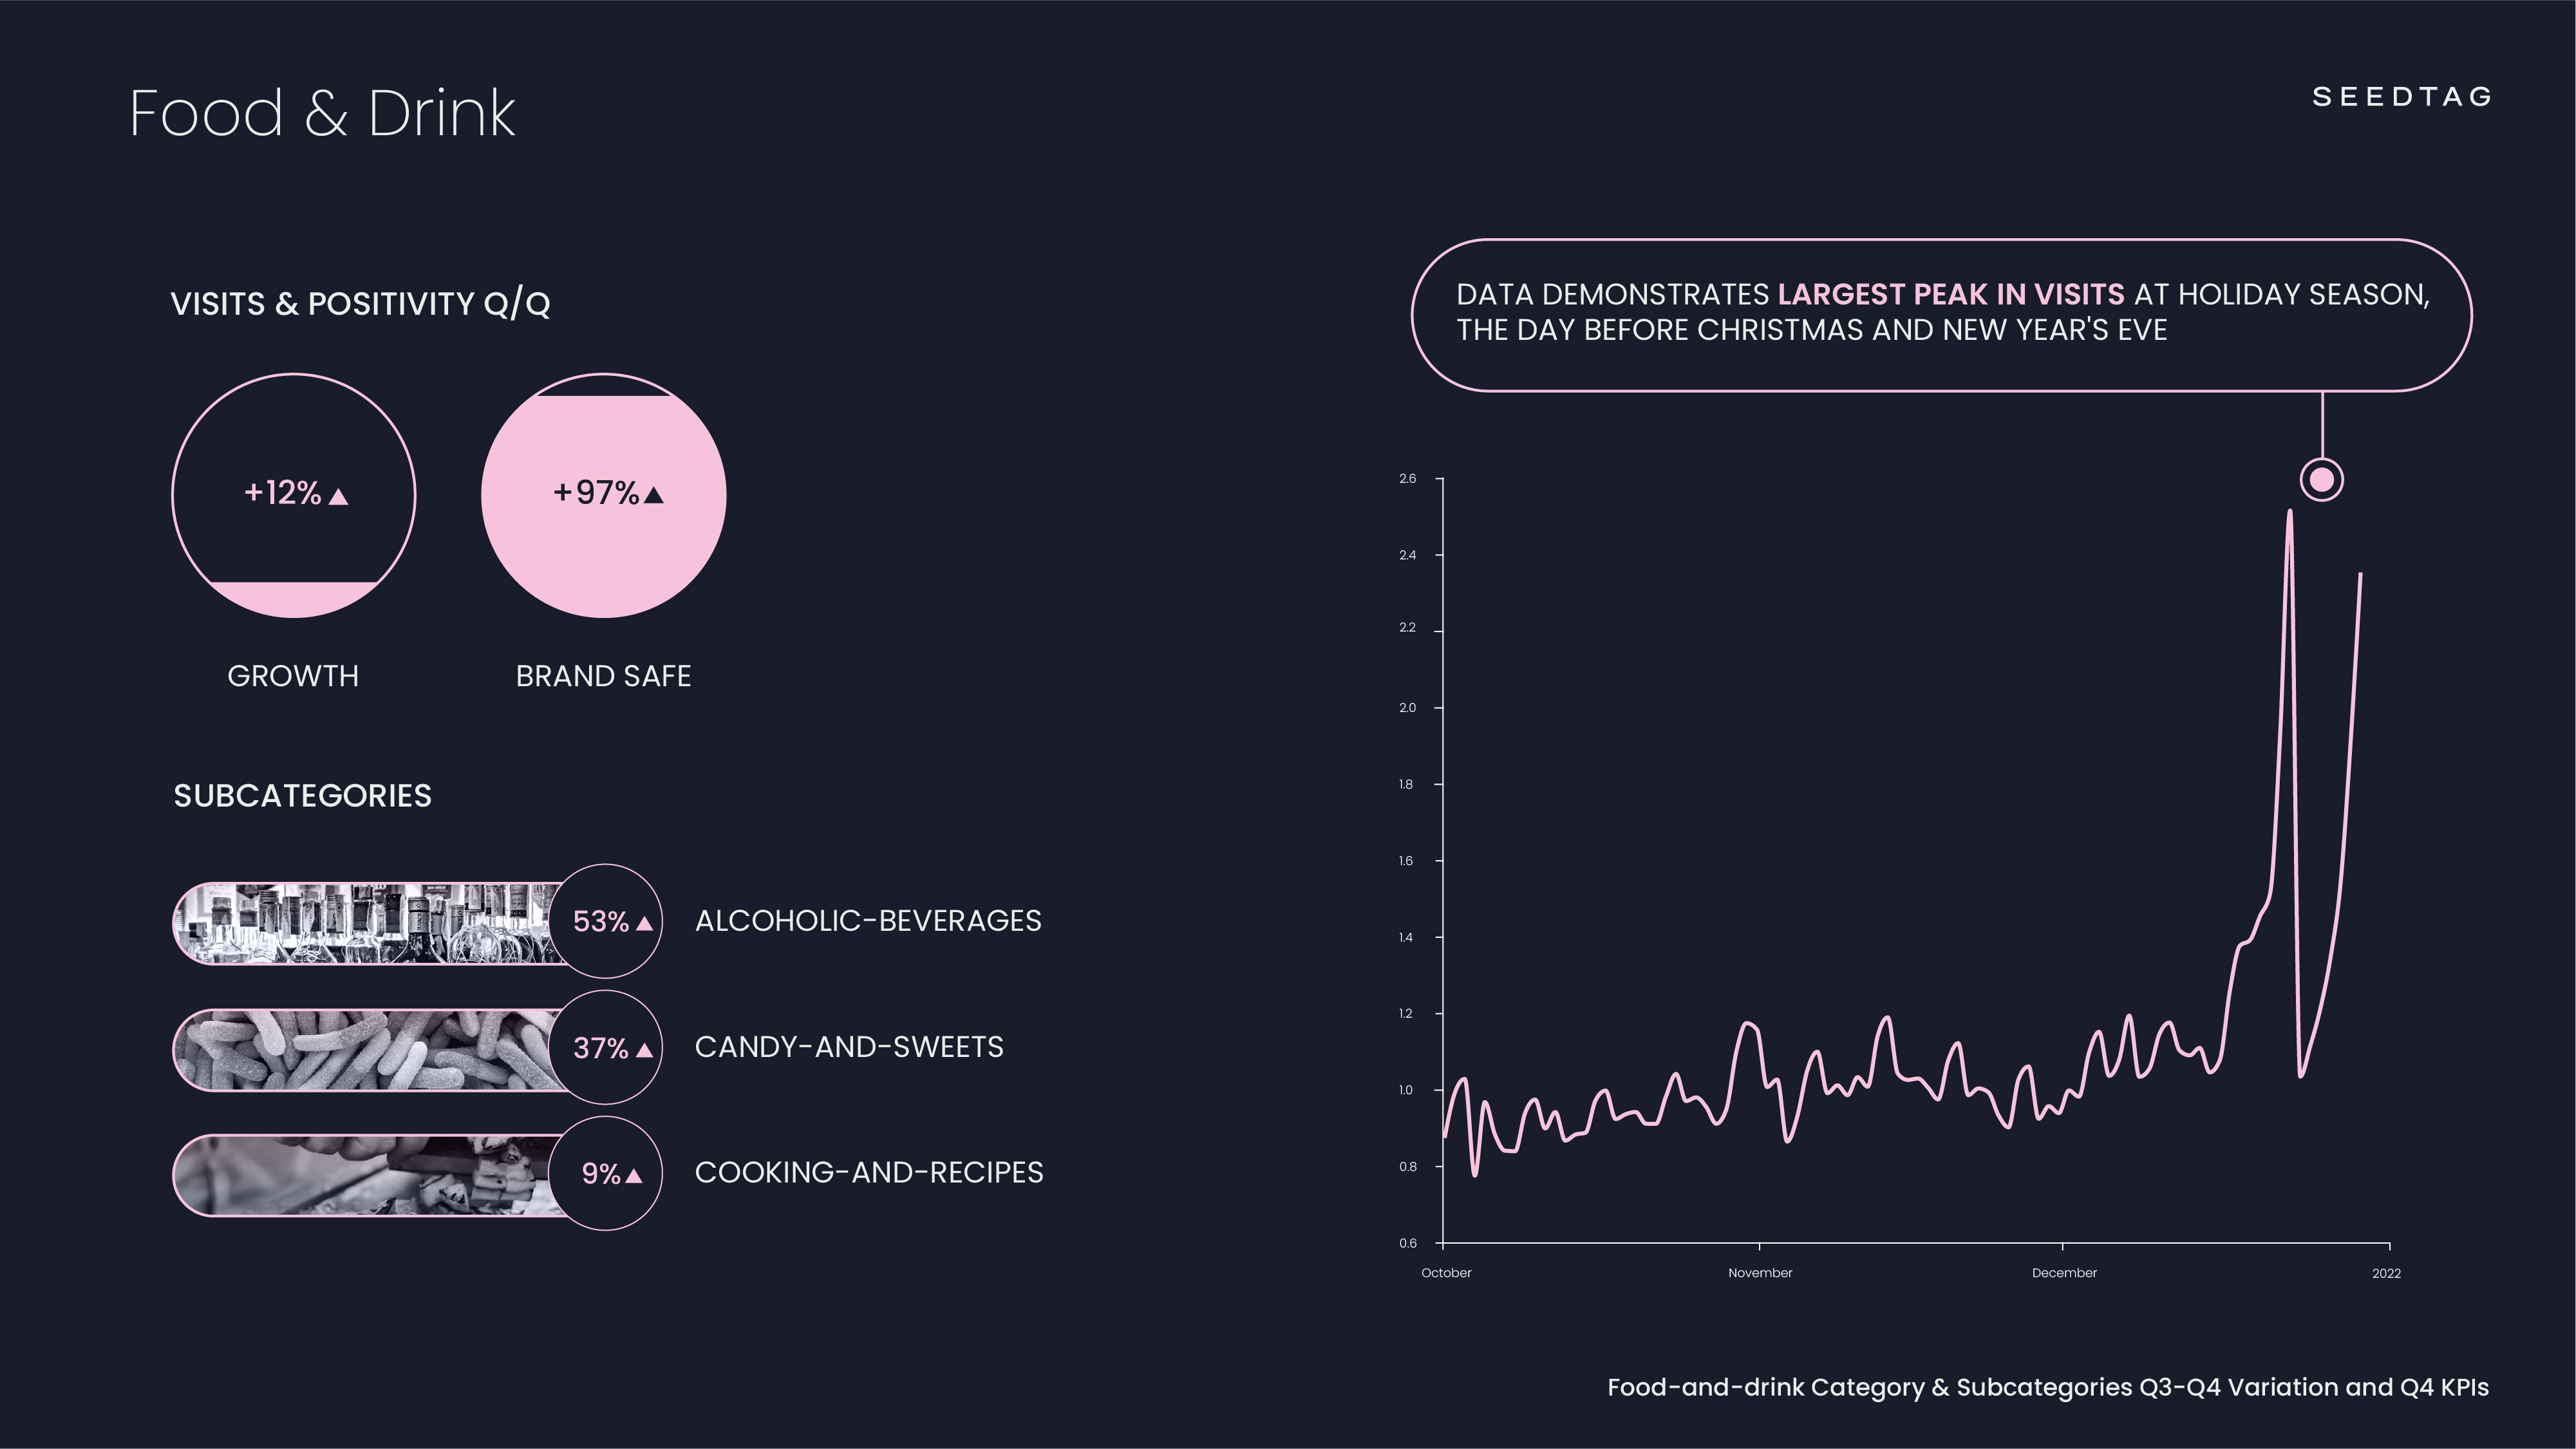
The final category which made an impact in Q4 was Food and Drinks (12% ▲), presenting the highest positivity rate with an impressive 97%. In other words, the majority of related content to this subject was deemed brand safe for advertisers. As for the associated subcategories, Alcoholic Beverages led with 53% growth this Q, followed by Candy and Sweets with 37%, and Cooking and Recipes with 9%. As individuals tend to spend more time together celebrating during the holidays of this Q, it's logical this category and its respective subcategories increase in the interest of consumers. Another category we saw had a growth this Q was Family and Parenting (11% ▲), also rational due to an increase in the importance of family time and the gift-giving nature of the season.
Specific dates of importance for data begin with Halloween on October 31, where candy and sweets, as well as cooking and recipes, drive immense traffic and attention. Thanks to the traditional Halloween custom of trick-or-treating, where children in costumes travel from house to house, asking for treats. This holiday is followed by Thanksgiving, celebrated across the U.S. on the fourth Thursday in November, this year being November 25, where cooking, drinks, and family are the main components. Finally, Christmas Eve and Christmas Day, December 24 and 25, respectively, are other holidays in which cooking, drink making, and toys are major elements.
--------
In this Q4 analysis, we reviewed the most relevant content insights & trends - but where did our findings come from?
Using our contextual artificial intelligence, LIZ©, we have processed data from our network of publishers around the world, analyzing their content using Natural Language Processing (NLP), tagging each article according to its subject matter with one of our contextual categories & subcategories, and identifying whether the content is brand safe for advertisers. We have filtered this information by date, in this case, Q4 (October 1st to December 31st, 2021), and compared it to the previous Q (July 1st to September 30th, 2021), evaluating each category separately according to traffic generated and the % of that traffic that is brand safe content (positivity).
--------
The analytics shown along with other data points were used by our advertisers in real time to boost their campaigns and increase association with their brand values. If you are interested in knowing more about how contextual data and AI can boost your brand, feel free to contact us.
